U.S. Textile Market Size is USD 758.99 Billion in 2026
U.S. Textile Market (By Product: Natural Fibers, Polyester, Nylon, Others; By Raw Material: Cotton, Chemical, Wool, Silk, Others; By Application: Household, Technical, Fashion) Industry Size, Share, Growth, Trends 2026 to 2035.


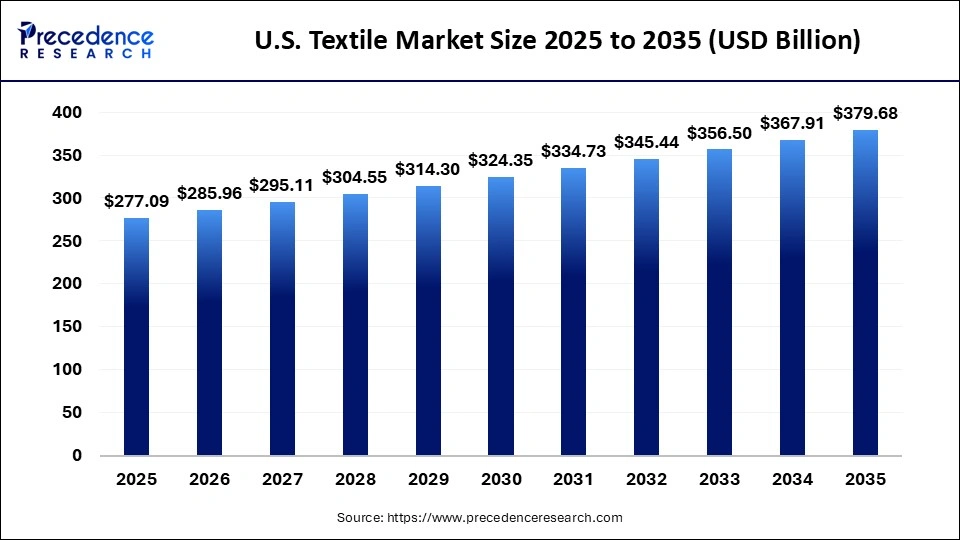
The U.S. textile market size was estimated at USD 277.09 billion in 2025 and is predicted to increase from USD 285.96 billion in 2026 to approximately USD 379.68 billion by 2035, expanding at A CAGR of 3.20% from 2026 to 2035. Due to rising demand for sustainable and high-performance fabrics, technological advancements, expanding industrial and medical applications, increasing e-commerce accessibility, and evolving fashion trends, all of which are driving innovation and boosting overall market growth.
U.S. Textile Market Statical Scope
| Reports Attributes | Statistics |
| Market Size in 2025 | USD 277.09 Billion |
| Market Size in 2026 | USD 285.96 Billion |
| Market Size by 2035 | USD 379.68 Billion |
| CAGR 2026 to 2035 | 3.20% |
| Base Year | 2025 |
| Forecast Period | 2026 to 2035 |
Technological advancements are transforming the US textile market with innovations in smart fabrics, performance textiles, and automated manufacturing processes, improving quality, efficiency, and sustainability. These developments are enabling the industry to meet growing consumer demand for durable, functional, and eco-friendly textile products.
Natural fibers, including cotton, linen, flax, silk, hemp, and wool, are eco-friendly, biodegradable, and renewable. Strong demand from the apparel and fashion sectors is expected to drive the growth of the natural fibers segment of the U.S. textile market.
U.S. Textile Market Share, By Product, 2025 (%)
| Segments | Shares (%) |
| Natural Fibers | 39.2% |
| Polyester | 34.10% |
| Nylon | 16.8% |
| Others | 9.90% |
- Natural Fibers- A strong consumer inclination towards sustainable and breathable materials, accounting for a 39.2% share, is reinforcing its dominance in the textile market.
- Polyester- Although its widespread use and cost-effectiveness account for a 34.10% share, this segment still falls short of overtaking natural fibers in overall demand.
- Nylon- Rising demand for durable high-performance fabrics holding a 16.8% share is positioning the segment as the fastest growing in the market.
- Others- Low adoption in key applications, accounting for a 9.90% share, keeps this segment relatively modest in size.
U.S. Textile Market Share, By Raw Material, 2025 (%)
| Segments | Shares (%) |
| Cotton | 45.2% |
| Chemical | 34.8% |
| Wool | 9.10% |
| Silk | 6.40% |
| Others | 4.5% |
- Cotton- A strong consumer preference for comfort predictability and natural textiles representing a 45.2% share, has cemented its leading position among raw materials.
- Chemical- Increasing adoption of high-performance synthetic textiles, representing a 34.8% share, is fueling its rapid growth as the fastest growing raw material.
- Wool- Regional demand constraints and higher costs accounting for a 9.10% share have limited its broader adoption.
- Silk- Premium pricing and niche usage representing a 6.40% share, have constrained its overall market reach.
- Others - Includes alternative fibers, with a 4.5% share, result in moderate contribution.
U.S. Textile Market Share, By Application, 2025 (%)
| Segments | Shares (%) |
| Household | 76.0% |
| Technical | 12.50% |
| Fashion | 8.9% |
- Household- Widespread use in home furnishings and everyday essentials, accounting for a 76.0% share, establishes it as the largest application segment.
- Technical- The rising demand in the industrial, medical and functional textile sectors holding at 12.50% share is fueling rapid market growth.
- Fashion- Rising trends and the demand for fast fashion, accounting for an 8.9% share, are driving rapid growth despite the segment's smaller base.
- Others- Limited Usage Across a few applications, representing just a 2.60% share keeps its impact on the market minimal.
Top Companies in the U.S. Textile Market
- INVISTA S.R.L.
- IBENA Inc.
- Belton Industries, Inc.
- Dewitt
- TenCate
- Mogul Co., Ltd.
- Siang May Pte Ltd.
- terrafix Geosynthetics
- HUESKER International
- Morenot
Segments Covered in the Report
By Product
- Natural Fibers
- Polyester
- Nylon
- Others
By Raw Material
- Cotton
- Chemical
- Wool
- Silk
- Others
By Application
- Household
- Technical
- Fashion
| Product | 2025 | 2026 | 2027 | 2028 | 2029 | 2030 | 2031 | 2032 | 2033 | 2034 | 2035 |
|---|---|---|---|---|---|---|---|---|---|---|---|
| Natural Fibers | 133.00 | 136.12 | 139.29 | 142.53 | 145.83 | 149.20 | 152.64 | 156.14 | 159.71 | 163.35 | 167.06 |
| Polyester | 83.13 | 86.64 | 90.30 | 94.11 | 98.06 | 102.17 | 106.45 | 110.89 | 115.51 | 120.31 | 125.29 |
| Nylon | 33.25 | 34.60 | 36.00 | 37.46 | 38.97 | 40.54 | 42.18 | 43.87 | 45.63 | 47.46 | 49.36 |
| Others | 27.71 | 28.60 | 29.51 | 30.46 | 31.43 | 32.44 | 33.47 | 34.54 | 35.65 | 36.79 | 37.97 |
| Raw Material | 2025 | 2026 | 2027 | 2028 | 2029 | 2030 | 2031 | 2032 | 2033 | 2034 | 2035 |
|---|---|---|---|---|---|---|---|---|---|---|---|
| Cotton | 88.67 | 90.93 | 93.25 | 95.63 | 98.06 | 100.55 | 103.10 | 105.71 | 108.38 | 111.11 | 113.90 |
| Chemical | 124.69 | 129.54 | 134.57 | 139.79 | 145.21 | 150.82 | 156.66 | 162.70 | 168.98 | 175.49 | 182.25 |
| Wool | 24.94 | 25.45 | 25.97 | 26.50 | 27.03 | 27.57 | 28.12 | 28.67 | 29.23 | 29.80 | 30.37 |
| Silk | 16.63 | 17.44 | 18.30 | 19.19 | 20.11 | 21.08 | 22.09 | 23.14 | 24.24 | 25.39 | 26.58 |
| Others | 22.17 | 22.59 | 23.02 | 23.45 | 23.89 | 24.33 | 24.77 | 25.22 | 25.67 | 26.12 | 26.58 |
Research Methodology
Related Databooks
March 2026
April 2026
April 2026
April 2026

 sales@precedenceresearch.com
 +1 804-441-9344
 Download Databook
 Schedule a Meeting