North America Dehumidifier Market Size is USD 1.43 Billion in 2026
North America Dehumidifier Market (By Technology: Refrigerative Dehumidifier, Desiccant Dehumidifier, Electronic/Heat Pump Dehumidifier; By Product, Portable, Fixed; By Application, Residential Industrial, Commercial) Industry Size, Share, Growth, Trends 2026 to 2035.


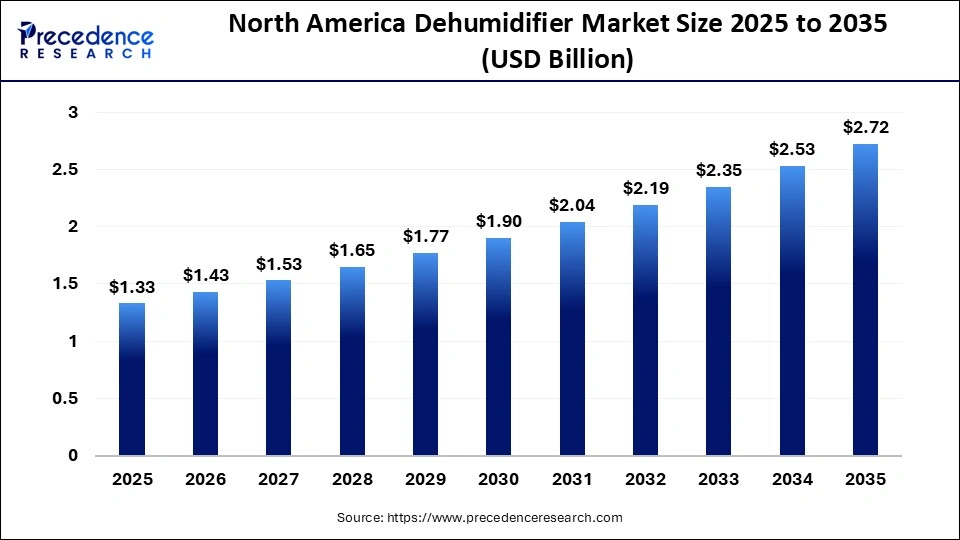
The North America dehumidifier market size was estimated at USD 1.33 billion in 2025 and is predicted to increase from USD 1.43 billion in 2026 to approximately USD 2.72 billion by 2035, expanding at A CAGR of 7.40% from 2026 to 2035. Growing awareness of the need to maintain a healthy lifestyle at home and in the workplace is driving the demand for dehumidifiers in North America.
North America Dehumidifier Market Statical Scope
| Reports Attributes | Statistics |
| Market Size in 2025 | USD 1.33 Billion |
| Market Size in 2026 | USD 1.43 Billion |
| Market Size by 2035 | USD 2.72 Billion |
| CAGR 2026 to 2035 | 7.40% |
| Base Year | 2025 |
| Forecast Period | 2026 to 2035 |
The dehumidifier market involves a range of device types and sizes to meet different needs and applications. Common types of dehumidifiers include refrigerative dehumidifiers, desiccant dehumidifiers, and whole-house dehumidification systems. These appliances are designed to reduce and maintain humidity levels in the air within specific spaces. They are commonly used in homes, commercial buildings, industrial facilities, and other environments to prevent issues such as mold growth, musty odors, and damage to sensitive materials.
An increase in food manufacturing sales is projected to positively impact the market, as dehumidifiers help maintain optimal moisture levels and prevent deterioration in food quality. Additionally, dehumidifiers ensure that the air remains dry and crisp, facilitating smoother and more efficient processes. These factors are likely to have a positive influence on the North American market.
Furthermore, rising consumer awareness about the benefits of humidity control for asthma patients is expected to increase the demand for refrigerative dehumidifiers across North America during the forecast period. These units are commonly used in basements, kitchens, storage rooms, bathrooms, and bedrooms in households.
The dehumidifier demand is growing primarily due to technological advancements. Today's dehumidifiers are more convenient, energy-efficient, and equipped with smart technologies that enhance performance and usability. Both household and commercial customers seeking reliable and cost-effective moisture control will value these improvements.
Artificial intelligence is significantly transforming the North American dehumidifier sector by enhancing operational efficiency, enabling predictive maintenance, and improving user experience. AI algorithms allow dehumidifiers to learn and adapt to environmental conditions, optimizing energy consumption by operating only when necessary and at the most efficient settings.
Additionally, AI integration supports advanced diagnostics and smart home connectivity, enabling users to monitor and control humidity levels remotely through smartphones applications. These intelligent systems can analyze historical data, weather forecasts, and occupancy patterns to anticipate humidity fluctuations, providing effective moisture management.
North America Dehumidifier Market Share, By Technology, 2025 (%)
| Segments | Shares (%) |
| Refrigerative Dehumidifier | 45% |
| Desiccant Dehumidifier | 30% |
| Electronic/Heat Pump Dehumidifier | 25% |
- Refrigerative Dehumidifier - High efficiency and widespread use in residential and commercial settings, with a 45% share, establish refrigerative dehumidifiers as the leading technology segment.
- Desiccant Dehumidifier - Strong performance in low-temperature environments, with a 30% share, supports demand but remains below refrigerative dominance.
- Electronic/Heat Pump Dehumidifier - Energy-efficient operation and growing adoption, with a 25% share, contribute but do not surpass leading technologies.
North America Dehumidifier Market Share, By Product, 2025 (%)
| Segments | Shares (%) |
| Portable | 55% |
| Fixed | 45% |
- Portable - High consumer preference for mobility and ease of installation, with a 55% share, establish portable units as the leading product segment.
- Fixed - Suitable for large-scale and permanent installations, with a 45% share, supports the market but remains below portable dominance.
North America Dehumidifier Market Share, By Application, 2025 (%)
| Segments | Shares (%) |
| Residential | 40% |
| Industrial | 30% |
| Commercial | 30% |
- Residential - High demand for indoor air quality and moisture control in homes, with a 40% share, establish residential as the leading application segment.
- Industrial - Strong use in manufacturing and storage facilities, with a 30% share, supports demand but does not surpass residential.
- Commercial - Demand from offices, retail, and hospitality sectors, with a 30% share, contributes significantly but remains below the leading segment.
Top Companies of North America Dehumidifier Market
- LG Electronics Inc.
- Honeywell International Inc.
- GE Appliances, a Haier Company
- De'Longhi Appliances S.r.l.
- Bry-Air Inc.
- Danby Products Ltd
- Whirlpool Corporation
- Munters Group
- STULZ Air Technology Systems, Inc.
- CondAir Group
Segments Covered in the Report
By Technology
- Refrigerative Dehumidifier
- Desiccant Dehumidifier
- Electronic/Heat Pump Dehumidifier
By Product
- Portable
- Fixed
By Application
- Residential
- Industrial
- Commercial
| Technology | 2025 | 2026 | 2027 | 2028 | 2029 | 2030 | 2031 | 2032 | 2033 | 2034 | 2035 |
|---|---|---|---|---|---|---|---|---|---|---|---|
| Refrigerative Dehumidifier | 0.18 | 0.19 | 0.21 | 0.22 | 0.23 | 0.26 | 0.28 | 0.30 | 0.32 | 0.34 | 0.36 |
| Desiccant Dehumidifier | 0.12 | 0.13 | 0.14 | 0.15 | 0.16 | 0.17 | 0.18 | 0.20 | 0.21 | 0.23 | 0.24 |
| Electronic/Heat Pump Dehumidifier | 0.10 | 0.11 | 0.12 | 0.12 | 0.13 | 0.15 | 0.15 | 0.16 | 0.18 | 0.19 | 0.21 |
| Product | 2025 | 2026 | 2027 | 2028 | 2029 | 2030 | 2031 | 2032 | 2033 | 2034 | 2035 |
|---|---|---|---|---|---|---|---|---|---|---|---|
| Portable | 0.22 | 0.23 | 0.26 | 0.27 | 0.29 | 0.31 | 0.34 | 0.36 | 0.39 | 0.41 | 0.44 |
| Fixed | 0.18 | 0.19 | 0.21 | 0.22 | 0.24 | 0.26 | 0.28 | 0.29 | 0.32 | 0.34 | 0.36 |
Research Methodology
Related Databooks
March 2026
April 2026
April 2026
April 2026

 sales@precedenceresearch.com
 +1 804-441-9344
 Download Databook
 Schedule a Meeting