


Electric Vehicle Charger Market Size, Key Companies, Company Technology / Innovation, Production Output, Market Penetration, Sales Analysis, Export Performance, Company Investment Strategies, and Customer Demand
Rising EV adoption, growing public charging networks, and demand for high-power charging are driving the global electric vehicle charger market. It is estimated at USD 24.16 billion in 2026 and should approach USD 212.18 billion by 2035, backed by heavy investment in residential, commercial, fleet, and highway charging. Advances in DC fast charging, liquid-cooled systems, bidirectional charging, and smart energy management are changing how companies compete. Supportive policy, rising EV production, and infrastructure build-out open opportunities for manufacturers, charging operators, and software providers in established and emerging markets.
Source: https://www.precedenceresearch.com/electric-vehicle-charger-market
 Get a Sample
 Table Of Content


What is the Electric Vehicle Charger Market Size?
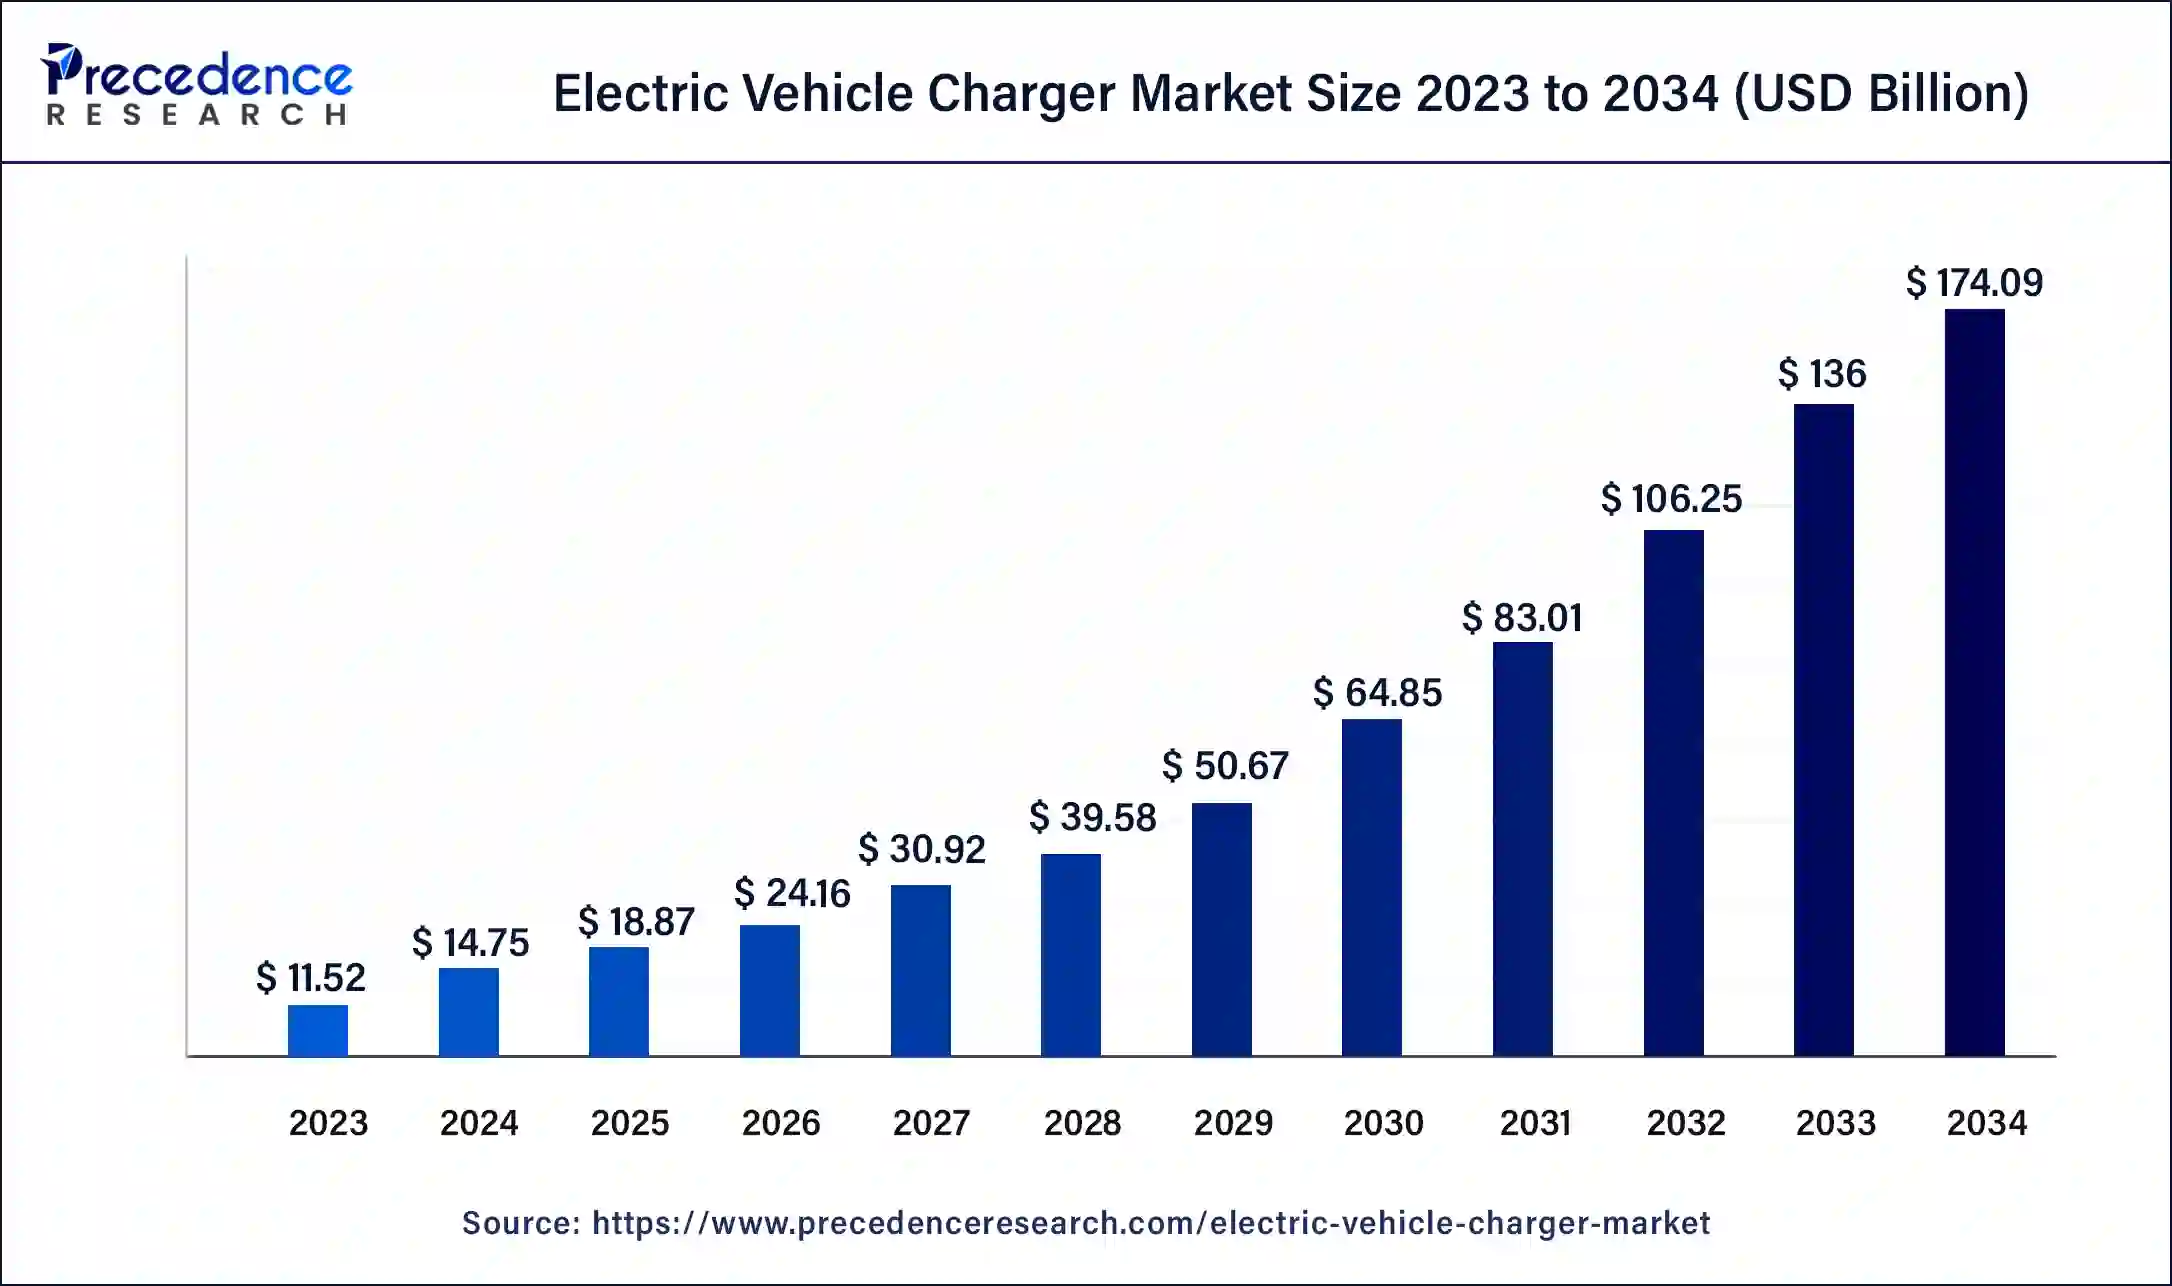
The global electric vehicle (EV) charger market size is predicted to increase from USD 24.16 billion in 2026 to approximately USD 212.18 billion by 2035, expanding at a CAGR of 27.38% from 2026 to 2035. The market is driven by the rising EV adoption, expanding charging infrastructure, government incentives, and increasing investments in fast-changing technologies worldwide.
Key Takeaways
- Rising EV adoption is driving investment in residential, commercial, public, workplace, highway, and fleet charging.
- DC fast chargers are gaining ground as networks aim for shorter charging times and higher utilization, while AC chargers stay essential at homes and workplaces were cars park longer.
- Asia Pacific is the main growth center, with China leading deployment, while North America and Europe expand public and high-power corridors.
- Charging power, connector compatibility, installation cost, grid capacity, and reliability increasingly shape buying decisions.
- Liquid-cooled power electronics enable faster charging but add thermal, protection, and integration demands.
- Smart charging, dynamic power allocation, and connected software raise utilization and cut operating costs.
- Bidirectional charging, including V2G and V2H, could add value through backup power and grid services.
- Fleet depots, buses, commercial vehicles, and logistics operations need dependable chargers with predictable operating costs.
- Manufacturers and operators must balance equipment pricing, installation cost, maintenance, electricity cost, and long-term profitability.
- Differentiation now rests on reliability, charging speed, software, interoperability, service coverage, manufacturing scale, and partnerships, while long-term growth depends on EV adoption, regulation, grid readiness, network economics, standards, and investment pace.
EV Charging is Shifting from Equipment Deployment to a High-Utilization Energy Infrastructure Market
The story is now about power delivered per charger more than charger count. Public charging capacity averaged about 4.5 kW per electric light-duty vehicle globally in 2025, and the average public charging point reached almost 50 kW, up from just over 40 kW in 2024. Ultra-fast charging is taking a bigger share of investment even though few vehicles can use the highest charging rates today
Asia Pacific remains the centre of deployment. China held more than 65% of global public charging points at the end of 2025 and accounted for more than three-quarters of public charger additions that year. Opportunity is widening toward Europe, North America, India, and emerging EV markets as highway corridors, fleet depots, multifamily housing, and commercial destinations grow in importance.
Key Coverage
- More than 43 million private light-duty EV charging points
- AC, DC fast and ultra-fast charger economics
- Residential, workplace, commercial, fleet, and public charging
- Hardware, software, services, and recurring-revenue models
- Regional deployment, utilization, and power-capacity economics.
Higher Power Ratings are Lifting Revenue Faster Than Unit Growth
The market is transitioning from the commoditized residential segment towards a more diverse set of DC fast charging, ultra-fast, commercial, fleet, and software-centric networks that span a growing range of applications and geographies.
Units represent a different perspective on the market, in which the number of global public chargers increased by more than 33% year-over-year in 2025, with nearly 1.8 million chargers deployed worldwide. The shift towards higher power, more sophisticated power electronics, networking and payment capabilities, as well as energy management, means revenue growth can continue to significantly outpace unit growth.
The full analysis keeps market value, charger shipments, installed base, charging capacity, and electricity throughput separate, so unit growth isn't mistaken for revenue growth.
Key Coverage
- Revenue and unit shipment forecasts
- Charger-capacity additions in GW
- Public/private installed-base projections
- Regional contribution to incremental revenue
- Base, upside, and downside scenarios
Segmentation Analysis
Where Do DC Fast and Commercial Charging Create the Most Value?
The market is segmented by AC versus DC, charging power, location, connectivity, application, vehicle type, connector architecture, and business model. Fast charging is already the largest value pool in several estimates, while Level 2 stays important because it is so widely deployed across homes, workplaces, and commercial properties.
The key distinction is between high-volume and low-power chargers and lower-volume but higher-power systems. Meanwhile, public ultra-fast chargers, which are capable of supplying more than 150 kW, are proliferating rapidly. The global stock of ultra-fast chargers increased by over 50% in 2024, while China saw the number of fast and ultra-fast chargers reach some 2.2 million by the end of 2026.
The report sizes the market across the categories below:
- AC Level 1/Level 2
- DC fast charging
- Ultra-fast charging above 150 kW
- Residential/private
- Workplace and destination
- Public urban
- Highway charging
- Fleet and depot charging
- Passenger vehicles versus commercial vehicles
- Fixed versus modular/distributed architectures
- Connected versus non-connected chargers
Market Dynamics
Can Utilization and Grid Economics Keep Chargers Profitable?
The rising number of electric vehicles is the key factor, but the economics of a particular charger installation increasingly depend on its utilization, location, electricity cost, demand charges, grid availability, and uptime. The number of public chargers has roughly tracked the growth of EV stock, at approximately 11 electric light vehicles per public charging point in 2025.
The constraint is shifting from charger availability to economically viable capacity. A 350-kW charger with low utilization can earn less than a lower-power site with steady throughput. That pushes operators toward dynamic load management, modular power systems, predictive maintenance, and software-controlled utilization.
Key Coverage
- EV penetration and charger intensity
- Utilization and throughput
- Electricity and demand-charge exposure
- Site economics
- Grid connection constraints
- Hardware commoditization
- Charger uptime and reliability
- Software-driven revenue optimization
Pricing Analysis
Charger Prices are Falling While Revenue Per Site Rises
Charging economics differ sharply by power rating, installation complexity, connectivity, and application. Hardware prices are falling while system value grows. Ultra-fast charger prices dropped about 20% between 2022 and 2024, even as average public charging power kept rising.
The report benchmarks ASPs across residential AC, commercial AC, 50 to 150 kW DC, 150 to 350 kW ultra-fast, and next-generation high-power systems. It splits hardware ASP, installation cost, electrical infrastructure cost, software fees, maintenance revenue, and charging-service revenue.
These economics show why competition is moving beyond the price of the charger box toward total cost of ownership, uptime, energy throughput, and recurring software and service revenue.
Key Coverage
- Charger ASP by power class
- Hardware versus installation economics
- DC fast-charger cost structure
- Software and network-management fees
- Service and maintenance economics
- Electricity and demand-charge impact
- Gross-margin benchmarks
Demand-Supply Analysis
Why are Grid and Site Readiness Harder to Fix Than Manufacturing?
Global manufacturing capacity is enough for mainstream AC and lower-power DC products. Supply gets tighter around high-power modules, semiconductors, transformers, switchgear, cables, connectors, and grid interconnection.
That leaves two different supply curves, a fairly scalable equipment supply chain and a slower infrastructure rollout. India shows the gap. Public charging points are projected to grow from about 75,000 at the end of 2024 to around 375,000 by 2030 under a stated-policy scenario, which means roughly 50,000 additions a year.
The full analysis models regional capacity, utilization, lead times, component bottlenecks, and demand-supply gaps.
Value Chain & Supply Chain
Power Electronics and Grid Integration Capture Increasing Strategic Value
The charger value chain runs from power semiconductors, transformers, switchgear, cables, and connectors through power modules, charger assembly, embedded software, charge-point management systems, installation, network operations, and maintenance.
Value is shifting toward suppliers that pair hardware with software, energy management, remote diagnostics, and lifecycle services. The report finds the margin pools and supplier concentration at each stage, with special focus on power electronics, thermal management, communications, and grid-interface components.
Technology & Innovation
Which Charging Technologies Will Change EV Charging Economics?
EV charging technology is moving past simple gains in charging speed toward higher power density, smarter power allocation, two-way energy flows, and grid-integrated designs. Next-generation systems are approaching 1.68 MW, and liquid-cooled power electronics, dynamic power sharing, Plug & Charge, isO 15118, vehicle-to-grid (V2G), vehicle-to-home (V2H), battery-buffered charging, and wireless charging are heading toward wider deployment. Yet only a minority of passenger EV models can use charging rates above 250 kW, so there is a wide gap between what chargers can deliver and what vehicles can accept. The race is shifting from maximum charger power toward getting the most from the link between charger capacity, vehicle acceptance rate, grid availability, and site utilization.
High-power charging will likely pay off first where utilization and dwell-time economics justify the extra capital cost, such as highway corridors, commercial fleets, heavy-duty vehicles, and busy public sites. For passenger cars, extreme power adds little until battery designs, thermal management, and charging curves catch up. Dynamic power sharing and modular designs may matter more in the near term than peak power, since they let operators spread capacity across several vehicles and raise utilization without a matching rise in grid connection needs. Suppliers and operators will compete more on power density, efficiency, uptime, thermal performance, interoperability, and energy-management intelligence than on output alone.
Bidirectional charging is the next big layer, able to turn a charger from an energy-delivery device into an energy-management asset. V2G and V2H could let EV batteries supply backup power, demand management, and grid-balancing services, though adoption depends on vehicle compatibility, communication standards, utility programs, battery-cycle economics, and regulation. The full report assesses maturity across AC, DC fast, ultra-fast, liquid-cooled, modular, battery-integrated, wireless, and bidirectional designs, benchmarking power ratings, efficiency, cooling needs, interoperability, charging protocols, deployment status, and commercialization timelines.
The same data is available as a charger technology database covering manufacturer, architecture, power rating, cooling technology, charging protocol, connector standard, bidirectional capability, efficiency, deployment geography, vehicle compatibility, commercialization stage, and launch year. Users can filter by power class, maturity, geography, and application to see where technical capability is moving faster than vehicle or infrastructure readiness.
Regulatory & Sustainability Analysis
Public Funding Speeds Deployment While Interoperability Becomes a Requirement
Public funding still drives deployment. European rules require high-power charging along major transport corridors, and U.S. federal programs have committed billions of dollars to charging infrastructure. India has allocated approximately USD 240 million under its EV-support framework for charging infrastructure, including targeted support for thousands of chargers.
The report reviews rules on charger safety, cybersecurity, interoperability, payment transparency, accessibility, grid connection, renewable-energy integration, and bidirectional charging.
Customer & Application Analysis
Do Fleet and Highway Charging Offer 7Economics?
Residential charging remains the prevalent option wherever dedicated parking is available, but commercial, fleet, and public charging have very different revenue and utilization characteristics. Fleet depots can offer predictable utilization, while highway sites require higher power density and throughput to justify the investment.
The analysis compares households, commercial property owners, fleet operators, logistics companies, transit agencies, retailers, workplaces, utilities, charging operators, and public authorities on buying criteria, utilization, uptime requirements, and switching barriers.
Competitive Landscape
Hardware Makers, Infrastructure Players, and Network Operators are Converging
Competition is organized around three models, namely charger manufacturing, integrated charging infrastructure, and network and service platforms. The lines between them are blurring as equipment makers add software and services and operators build their own hardware and energy-management tools.
Winners tend to combine power-electronics expertise, manufacturing scale, software, installation capability, site access, and recurring customer relationships. Network operators are also judged on utilization and throughput, not just installed units.
EVgo, the U.S. public fast-charging operator, generated USD 384 million of 2025 revenue, including USD 218 million from charging-network revenue. Network throughput reached 366 GWh, up 32% year over year, and the operating network reached about 5,100 stalls.
ChargePoint, a leading networked charging-equipment provider, reported USD 411.2 million of fiscal 2026 revenue, with subscription revenue reaching USD 162.4 million. That shows how much recurring software revenue now matters alongside equipment sales.
Tentative Leading Company Universe
| Company | Headquarters | Market Position | Core Strength | Major Applications |
| Tesla | U.S. | Integrated leader | Fast charging/network | Highway, public |
| ABB | Switzerland | Global equipment player | DC fast charging | Public, fleet |
| Siemens | Germany | Infrastructure leader | High-power systems | Fleet, highway |
| Schneider Electric | France | Energy-management player | AC, energy management | Commercial |
| ChargePoint | U.S. | Networked charging specialist | Hardware/software | Commercial, fleet |
| Wallbox | Spain | Smart-charging specialist | AC/DC, energy management | Residential/commercial |
| Delta Electronics | Taiwan | Power-electronics leader | DC charging | Commercial/fleet |
| Star Charge | China | High-volume manufacturer | AC/DC hardware | Residential/public |
| TELD | China | Charging-network operator | Network infrastructure | Public |
| SK Signet | South Korea | DC fast specialist | High-power charging | Highway |
| Kempower | Finland | DC fast specialist | Modular DC | Fleet/public |
| Alfen | Netherlands | European specialist | AC charging | Residential/C&I |
| Tritium | Australia/U.S. | DC fast specialist | High-power DC | Public |
| EVgo | U.S. | Network operator | DC fast charging | Public |
| Blink Charging | U.S. | Network operator | AC/DC network | Commercial/public |
| Webasto | Germany | Automotive supplier | Charging hardware | Residential/commercial |
| Autel Energy | China | Technology challenger | AC/DC charging | Residential/commercial |
| XCharge | China/Germany | Charging technology player | High-power systems | Commercial |
| EO Charging | U.K. | Fleet specialist | Depot charging | Fleets |
| ADS-TEC Energy | Germany | High-power specialist | Battery-buffered charging | High-power sites |
| BP Pulse | U.K. | Network operator | Public/fleet | Highway |
| Shell Recharge | U.K. | Integrated energy player | Network/energy | Public/commercial |
| Eaton | Ireland/U.S. | Electrical infrastructure player | Power management | Commercial/fleet |
| Exicom | India | Regional/global challenger | DC fast charging | Public/fleet |
Market Share & Competitive Ranking
Scale Matters, but Charging Revenue Exposure Varies Widely
Corporate revenue rarely maps cleanly to charger revenue, so the market looks fragmented. Diversified electrical-equipment companies can have much larger total sales than pure-play charging businesses without having more charger exposure.
The report estimates share using charger revenue, shipments, installed base, networked ports, public charging throughput, and regional exposure, rather than total corporate revenue alone.
ChargePoint's more than 1.37 million connected public and private ports show the scale network effects can reach, while EVgo's 366 GWh of 2025 throughput shows why utilization matters as much as installed base.
Key Coverage
- Top-5 and Top-10 market-share estimates
- Hardware versus network share
- AC versus DC competitive positions
- Regional share
- Share gain/loss
- Installed-base comparison
- Revenue exposure to EV charging
Competitive Benchmarking
Reliability, Utilization, and Software Now Set Companies Apart
Leading companies are compared on revenue, charging exposure, installed base, charger power, product breadth, gross margin, geographic reach, R&D, software, uptime, manufacturing footprint, customer base, and partnerships.
The analysis separates scale leaders from technology specialists and network operators and shows whether each company's advantage comes from manufacturing economics, customer access, or software.
Product & Technology Benchmarking
Power Architecture is Replacing Basic Connectivity as the Competitive Gap
The report covers the comparison of the portfolios of the AC, DC, ultra-fast, modular, liquid-cooled, bidirectional, and megawatt-class platforms. Technology benchmarking includes analysis of charging efficiency, achievable power density, dynamic load sharing, interoperability, cybersecurity, and software architecture.
The report also tracks the evolution in North America towards the adoption of the J3400/NACS standard among automotive manufacturers and accelerating product convergence.
Geographic Competition
China Leads on Scale While Europe and India Build Momentum
China commands over 65% of the world's public charging points in 2026, representing the largest manufacturing and deployment ecosystem. Europe is focused on the development of a major high-power corridor network, while the United States, despite being a high-value market, has more cars per public charging point.
India is the clearest expansion story, with public charging points expected to grow about fivefold by 2030 under the stated policy scenario.
The report maps manufacturers, operators, deployment economics, localisation, policy support, and import dependence by country.
Manufacturing & Capacity Benchmarking
Scale and Modular Production are Pushing Hardware Costs Down
The production analysis examines the companies' production sites, regional concentrations, production volumes, utilization rates of their capacities, degree of localization, and vertical integration, as well as the potential suppliers of components.
The competitive landscape is intense in the European AC charging market, where the overall volumes are substantial, while prices are relatively low. For instance, Alfen, a Netherlands-based manufacturer, has booked a significant number of charge points (28,900 units) in Q3 2025, while its revenues from EV charging declined YoY due to increased competition.
Customer & Channel Benchmarking
Why Do Fleet and Site-Host Relationships Create Stronger Loyalty?
The report compares direct sales, distributors, utilities, automotive relationships, charge-point operators, fleet integrators, and commercial site hosts.
Customer loyalty depends more and more on software integration, payment systems, uptime, fleet-management compatibility, service contracts, and data portability, and less on the physical charger.
Strategic Developments
High-Power Charging and Lifecycle Services Lead Investment Themes
Recent product launches suggest a trend towards higher power ratings and more modular systems. The new platforms are capable of several hundred kilowatts per dispenser and can distribute this capacity among multiple vehicles.
The report considers product launches, capacity expansions, fleet partnerships, corridor developments, localization initiatives, software platforms, and network expansion by key companies operating in the industry during the period of 2024-2026.
M&A Landscape
What are Buyers Seeking in EV Charging Deals?
Recent deals are characterized by a preference among strategic buyers for the scope of established charging technologies, as well as the charging geography footprint. For instance, in August 2024, Exicom Tele-Systems Ltd. agreed to acquire the business and assets of Tritium, an Australian DC fast-charging company, which had sold over 13,000 DC fast chargers in approximately 47 countries. The acquired assets include Tritium's manufacturing facility in Tennessee, U.S., and its engineering center in Brisbane, Australia.
The M&A research evaluates transactions on the basis of the value of the deals, technologies, geographies, categories of chargers, access to customers, as well as vertical-integration rationale.
Company Profiles & Strategic Positioning
Advantage Depends on More Than Charger Shipments
Detailed profiles cover financial exposure, charger revenue, products, installed base, technology, manufacturing, geography, customers, R&D, partnerships, M&A, and strategic priorities.
Companies are positioned as market leaders, scale leaders, technology leaders, regional leaders, application specialists, and emerging challengers, based on demonstrated market position and capabilities and not on a proprietary score.
Opportunity & White-Space Analysis
Where are the Untapped Pools in High-Power and Fleet Charging?
The analysis finds opportunities in the areas below:
- Ultra-fast highway charging
- Fleet and depot electrification
- Multifamily residential charging
- Commercial energy management
- Bidirectional/V2G charging
- Battery-buffered charging
- Emerging-market localization
- High-reliability public networks
- Charging-as-a-service
- Charger software and lifecycle services
The biggest pools will likely appear where charger utilization, electricity economics, and vehicle charging capability meet, and not simply where installation volumes are highest.
Industry Structure
Fierce Hardware Rivalry Meets Real Technical Barriers to Entry
- Supplier Power: Medium. Power semiconductors, transformers, switchgear, and grid equipment can limit supply, especially at high power.
- Buyer Power: Medium to High. Large fleets, utilities, property owners, and operators can push hard on equipment pricing.
- Threat of New Entrants: Medium. Assembling hardware is easy, but certification, reliability, software integration, field service, and customer qualification take longer.
- Threat of Substitutes: Low to Medium. Alternatives such as battery swapping fit only certain vehicle and operating models.
- Competitive Rivalry: High. Hardware price competition is fierce, and differentiation is shifting toward reliability, software, power density, and lifecycle economics.
PESTLE Analysis
How Will Policy and Grid Limits Shape the Next Investment Cycle?
- Political: Charging subsidies and emissions policy.
- Economic: EV penetration and electricity prices.
- Social: Urbanization and consumer charging behavior
- Technological: Power-electronics innovation and cybersecurity.
- Legal: Interoperability requirements.
- Environmental: Grid capacity as EV adoption grows.
The main outside risk is that EV adoption outpaces grid and site infrastructure, creating local bottlenecks even when global manufacturing capacity is enough.
Market Attractiveness
Why Do Returns Differ So Much Across Charger Categories?
Attractiveness varies widely by segment. High-utilization fleet charging, premium DC fast charging, software-enabled network management, and grid-integrated charging offer very different economics from commoditized residential hardware.
Each opportunity is rated on market size, CAGR, utilization, pricing power, capital intensity, competition, customer concentration, regulatory support, and technology barriers.
Future Outlook
Will the Market Shift from More Chargers to More Capacity Per Site?
The technology frontier will move toward 250 to 600 kW passenger-vehicle charging, megawatt-scale commercial-vehicle charging, dynamic power allocation, V2G, battery-buffered charging, and intelligent energy management. Hardware price pressure will continue, which raises the weight of software, service contracts, uptime, and recurring revenue.
The report builds base, upside, and downside scenarios around EV adoption, charging utilization, charger ASPs, policy support, grid availability, and high-power charging penetration. It also points to the technologies, applications, geographies, and business models best placed to capture future profit pools.
Key Strategic Questions
- How much of future revenue will come from AC, DC fast and ultra-fast charging?
- Which applications offer the highest utilization and most attractive economics?
- How quickly will charger ASPs decline as power density increases?
- Where are charging capacity and grid availability becoming bottlenecks?
- Which regions will contribute the largest incremental charger revenue?
- How will NACS, isO 15118, Plug & Charge, and bidirectional charging reshape product requirements?
- What is the relative economics of residential, workplace, fleet, destination, and highway charging?
- Which companies have the greatest exposure to high-growth DC and ultra-fast charging?
- Which competitors possess structural advantages in manufacturing, software, network access, and customer relationships?
- How concentrated is the charger market by revenue, installed base, and charging throughput?
- Which charger categories are most vulnerable to commoditization?
- Where are the largest geographic, application, and technology white spaces?
Electric Vehicle Charger Market Segments
By Charger Type
- AC Chargers
- DC Chargers
By Charging Power
- Low-Power Chargers
- Medium-Power Chargers
- Fast Chargers
- Ultra-Fast Chargers
By Charging Location
- Residential
- Workplace
- Commercial and Destination
- Public Charging Stations
- Highway Charging Stations
- Fleet Depots
By Connectivity
- Smart/Connected Chargers
- Non-Connected Chargers
By Application
- Residential Charging
- Public Charging
- Commercial Charging
- Fleet Charging
- Workplace Charging
By Vehicle Type
- Passenger Cars
- Light Commercial Vehicles
- Heavy Commercial Vehicles
- Buses
- Other Electric Vehicles
By Connector Architecture
- CCS
- CHAdeMO
- NACS/J3400
- GB/T
- Type 1
- Type 2
- Other Connectors
By Business Model
- Charger Sales
- Charging-as-a-Service
- Charging Network Operations
- Software
- Subscription Services
By Region
- North America
- Europe
- Asia Pacific
- Latin America
- Middle East and Africa
For inquiries regarding discounts, bulk purchases, or customization requests, please contact us at sales@precedenceresearch.com
Frequently Asked Questions





Ask For Sample
No cookie-cutter, only authentic analysis – take the 1st step to become a Precedence Research client
 Get a Sample




 sales@precedenceresearch.com
 Schedule a Meeting