


Additive Manufacturing Market Size, Key Companies, Company Market Share, User Adoption, Technology Deployment, Revenue Growth, Competitive Positioning, and Demand Forecast
Rising demand for complex components, lightweight structures, customized products, and cost-efficient manufacturing is speeding up additive manufacturing adoption across aerospace, healthcare, automotive, and industrial uses. The global market was valued at USD 31.16 billion in 2026 and is forecast to grow at a 18.45% CAGR. Progress in metal and polymer printing, multi-laser systems, AI-driven process optimization, automated post-processing, and digital manufacturing workflows supports this growth. Wider use of production-grade parts and specialized materials is opening new room for equipment makers, material suppliers, software providers, and printing service companies.
Source: https://www.precedenceresearch.com/additive-manufacturing-market
 Get a Sample
 Table Of Content


What is the Additive Manufacturing Market Size?
The global additive manufacturing market size is predicted to increase from USD 31.16 billion in 2026 to approximately USD 140.90 billion by 2035, expanding at a CAGR of 18.45% from 2026 to 2035.
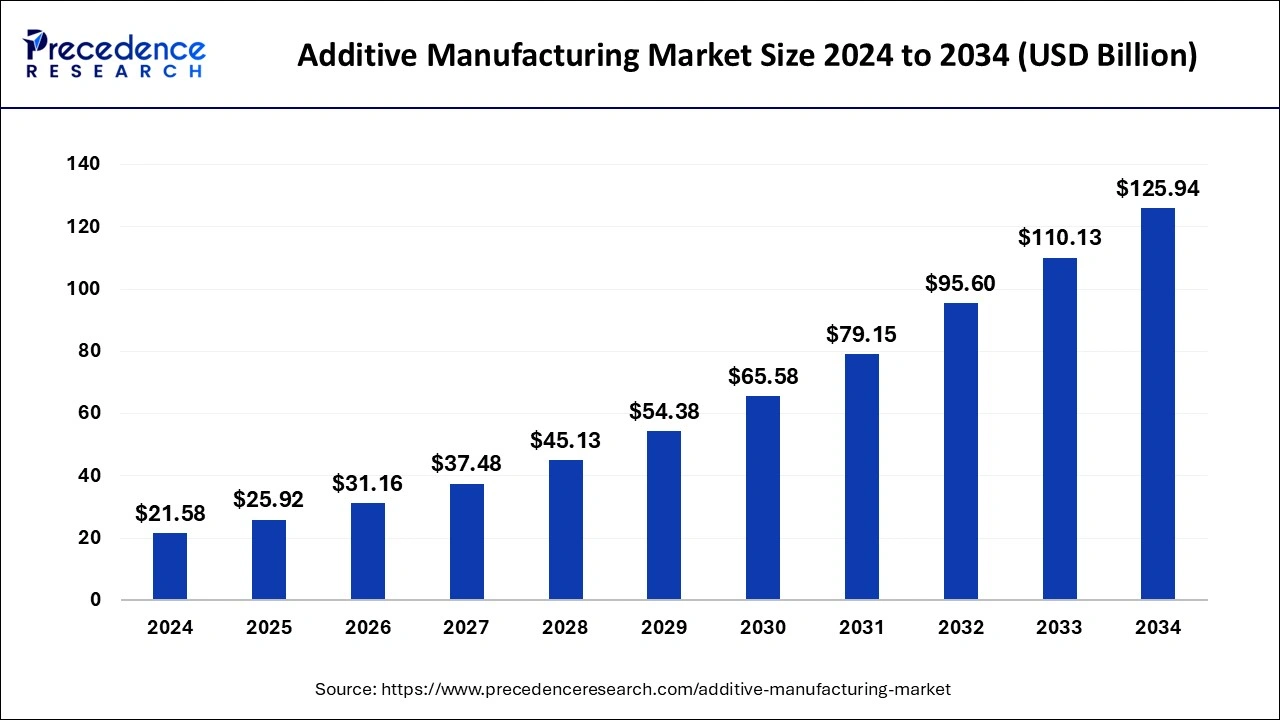
Key Takeaways
- Printing services made up about 48% of 2026 revenue, followed by systems and servicing at 26%, materials at 20%, and software at 6%.
- Services grew about 15.5% in 2026, while system sales grew only 3.6%, which suggests customers want manufacturing output more than equipment.
- Asia Pacific companies recorded about 19.8% average revenue growth in 2026, ahead of the Americas and Europe, the Middle East, and Africa.
- Metal AM holds outsized value through aerospace, healthcare, energy, and industrial parts that need complex shapes, low weight, and high performance.
- Multi-laser systems, bigger build volumes, automated powder handling, and process monitoring are lifting productivity.
- AI, generative design, simulation, and digital twin help cut variability and tie workflows together.
- Adoption depends on cost per qualified part, throughput, material use, repeatability, post-processing, and certification more than on printer specifications.
- Aerospace and defense made up nearly 30% of broader 3D printing revenue in 2026.
- Qualification, validation, inspection, and traceability raise entry barriers in safety-critical work.
- Winners will combine hardware, materials, software, application engineering, and production services, and consolidation is reshaping the field.
Overview
Why is Additive Manufacturing Shifting Toward Production Economics?
The next stage of growth will depend on cost per part, throughput, qualification, repeatability, and production economics, not on printer availability.
UnionTech's quad-laser SLM printer, shown at RAPID + TCT 2026, is one example of throughput gains being built straight into new hardware. (UnionTech) Asia Pacific is showing the strongest momentum and outgrew North America and Europe in 2026, while industrial polymer shipments stayed flat and metal systems saw uneven demand.
The market is splitting into distinct profit pools. These include production services, industrial metal systems, high-performance polymer systems, specialty materials, software and digital workflow, healthcare and dental, aerospace and defense qualification, and distributed manufacturing. The full report sizes each one by technology, material, application, customer industry, geography, printer class, revenue model, and competitive position.
Key Coverage
- Revenue split across services, systems, materials, and software
- Industrialization versus prototyping economics
- Regional growth and installed-capacity trends
- Production-part adoption and utilization
- Emerging high-value profit pools
- Market maturity and fragmentation assessment
Segmentation Analysis
Metal Captures High Value While Polymer Keeps Scale
AM segmentation needs more detail than a simple split between polymer and metal. The market is analyzed by material, technology, machine type, application, end-use industry, business model, printer price class, and geography.
Metal AM holds an outsized share of value because titanium, nickel alloys, aluminum, and stainless steel are tied to aerospace, defense, medical implants, energy, and other performance-critical parts. Under broader 3D printing categories, metals accounted for around 59% of revenue in the 2026 market projection, underscoring the revenue leverage of metal-based systems and applications.
Powder bed fusion remains a central pillar of industrial additive manufacturing, whereas material extrusion dominates less capital-intensive prototyping and distributed manufacturing. Other technologies, including binder jetting, directed-energy deposition, vat photopolymerization, and material jetting, carve out niches in the market on the basis of throughput, resolution, materials versatility, or post-processing requirements.
The higher-end spectrum consists of production parts metal 3D printing, healthcare/dental applications, aerospace/defense, and high-performance industrial categories. More commodity-oriented polymer additive manufacturing technologies maintain their value in design iteration, tooling, educational, and decentralized production arenas.
Key Coverage
- Metal, polymer, ceramic, and composite materials
- Powder bed fusion, material extrusion, vat photopolymerization, binder jetting, and DED
- Prototyping versus tooling versus end-use production
- Industrial versus desktop systems
- Aerospace, automotive, healthcare, dental, electronics, and industrial applications
- Largest, fastest-growing and highest-value segments
- Segment-level revenue, CAGR and growth contribution
Market Dynamics
What Decides Whether Companies Adopt Additive Manufacturing at Scale?
The important shift in AM is from proving the technology works to proving the economics. Demand is supported by lightweighting, complex shapes, customization, shorter development cycles, local manufacturing, lower inventory, and supply-chain resilience. Adoption is still held back where conventional processes cost less per unit at established volumes.
The 2026 data shows this transition clearly. AM services grew about 15.5% while system sales grew only about 3.6%, which suggests customers want manufacturing output more than they want to own equipment. (Wohlers)
Five thresholds matter most, namely part qualification, throughput, repeatability, total cost per part, and post-processing burden. Technologies that improve these can move AM from low-volume work into higher-volume applications.
Key Coverage
- Production economics
- Utilization and throughput
- Qualification barriers
- Labor and post-processing intensity
- Supply-chain resilience
- Customization economics
- Adoption drivers and restraints
- Technology-specific opportunity pools
Pricing Analysis
Total Cost Per Qualified Part Now Matters More Than Printer Price
AM pricing increasingly reflects the whole production workflow, not just what the printer costs. Industrial systems can sell for far more than desktop equipment, and metal systems carry heavier capital costs because of lasers or electron-beam sources, powder handling, inert environments, monitoring, and post-processing.
The report benchmarks printer ASP, material price per kilogram, machine-hour economics, energy use, labor cost, build utilization, post-processing cost, and final cost per part. Service bureau pricing is covered through machine-hour rates, material surcharges, engineering charges, and finishing costs.
Cheaper hardware will not automatically lower total production cost. The deciding factor is how productively each installed machine is used, since depreciation, labor, and facility costs have to be spread across qualified output.
Key Coverage
- Printer ASP by technology and class
- Polymer and metal material pricing
- Machine-hour economics
- Cost per part
- Energy and labor contribution
- Post-processing economics
- Service-bureau pricing
- Gross-margin and utilization sensitivity
Demand-Supply Analysis
is Installed Capacity Growing Faster Than Qualified Production Demand?
The supply side is getting more complex. Installed capacity keeps expanding while machine utilization varies widely by technology and region. Industrial AM demand is strongest where machines fit into repeatable production workflows, while some professional and mid-range segments face pressure from cheaper systems and commoditization.
The market is analyzed through installed machines, annual shipments, production capacity, utilization, build volume, material consumption, service capacity, and regional manufacturing footprints. Metal powder bed fusion showed strong unit momentum in late 2026, while broader metal shipments stayed weak, a sign of how far technology-specific economics can diverge.
Key Coverage
- Installed base
- Printer shipments
- Capacity utilization
- Regional supply-demand balance
- Machine lead times
- Material availability
- Production-service capacity
- Bottleneck technologies
Value Chain & Supply Chain
Where Does Value Sit Beyond the Printer Itself?
The AM value chain runs from powder, resin, filament, and specialty feedstock through machine hardware, process software, simulation, printing, post-processing, inspection, and final certification. Profit is spread across far more stages than the printer alone.
Materials qualification, software-based process control, post-processing, and application engineering are becoming more important places to capture value. The full report maps cost and margin pools across raw materials, machine manufacturing, distribution, service bureaus, contract manufacturing, and end-use customers.
Key Coverage
- Raw materials and feedstocks
- Printer manufacturing
- Software and digital workflow
- Printing services
- Post-processing
- Inspection and qualification
- Distribution economics
- Margin pools and bottlenecks
Technology & Innovation
Which Technologies Will Make AM Economical at Production Scale?
The next technology cycle in AM centers on productivity, repeatability, and production economics, not just print resolution. Multi-laser systems, larger build volumes, automated powder handling, in-situ monitoring, and faster polymer systems target the industry's core limits of build time, machine utilization, labor, and cost per qualified part. At IMTS 2026, EOS unveiled its M4 Onyx, an automated production platform that can swap build frames and restart production on its own, with up to 97% availability. (EOS) AI-assisted parameter tuning and digital workflow tools are also gaining ground as manufacturers try to control process variability and speed up qualification.
Software and process intelligence are becoming a key layer of difference. Production AM generates large amounts of data that can link CAD, build preparation, simulation, machine monitoring, and quality assurance into one digital thread. Manufacturing Connected, a cross-vertical intelligence platform from Gardner Business Media, launched in 2026 to support this shift. It reflects how AM is moving from single-machine workflows to data-driven manufacturing systems that favor integrated ecosystems over standalone printers. (Manufacturing Connected)
In practice, future adoption will hinge on cost per qualified component, throughput, material use, automated post-processing, and qualification time. Multi-laser metal systems, binder jetting, high-speed polymer platforms, and digital twins are different routes to the same goal, which is making AM competitive at scale. The full report assesses technology maturity, build productivity, material compatibility, automation, commercialization status, and patent activity. It is also available as a technology and innovation database that can be filtered by productivity, application, material, and maturity.
Key Coverage
- Multi-laser architectures
- Binder jetting
- High-speed polymer technologies
- Process monitoring
- AI and generative design
- Simulation
- Digital twins
- Automated post-processing
- Material qualification
Regulation & Sustainability
Why are Qualification Standards Becoming a Competitive Barrier?
Adoption of AM in aerospace, defense, healthcare, and other safety-critical uses depends on process qualification, material traceability, machine validation, inspection, and repeatability. These requirements keep newcomers out and raise the value of established production ecosystems.
Sustainability gains come from lightweighting, lower buy-to-fly ratios, near-net-shape production, local manufacturing, and possible inventory cuts. Energy use, powder recycling, and post-processing need to be judged case by case.
Key Coverage
- Aerospace and defense qualification
- Medical and dental requirements
- Material traceability
- Process validation
- Powder recycling
- Energy consumption
- Waste reduction
- Circular manufacturing
Customer & Application Analysis
Aerospace, Healthcare, and Industrial Production Offer the Highest-Value Adoption
Aerospace and defense remain key AM applications because complex shapes and lighter parts can deliver large performance gains. Healthcare and dental benefit from customization and patient-specific production, while industrial customers use AM for tooling, spare parts, and low-volume production.
Across broader 3D printing estimates, aerospace and defense made up nearly 30% of 2025 revenue, which shows how much value sits in technically demanding applications.
The report evaluates buying criteria such as cost per part, qualification, dimensional accuracy, surface finish, production speed, material availability, machine reliability, software compatibility, and technical support, and sizes revenue and growth by application.
Key Coverage
- Aerospace and defense
- Healthcare and dental
- Automotive
- Industrial machinery
- Electronics
- Energy
- Consumer products
- Application-level economics
Competitive Landscape
Market Consolidating Around Integrated Platforms?
The market is moving from a scattered printer business toward integrated AM ecosystems that bundle hardware, materials, software, services, and application know-how. Scale still counts, but technology specialization and qualification capability increasingly decide who competes well.
The landscape is analyzed across revenue, AM exposure, technology portfolio, material breadth, geographic footprint, installed base, service capability, R&D, patents, application exposure, manufacturing footprint, and strategic activity.
Recent deals show the trend. A major transaction involving Desktop Metal closed at about USD 180 million in 2025, followed by a Chapter 11 restructuring later that year, which highlights both the strategic value and the financial risk of scaling AM portfolios. (Bondoro) Separately, Stratasys proposed a 2026 acquisition of Markforged valued at about USD 42.5 million, showing continued consolidation around industrial polymer and composite technologies. (DailyCADCAM)
Companies Shaping the Additive Manufacturing Market
| Company | Headquarters | Market Position | Core Strength | Major Applications/Segments |
| Stratasys | US/Israel | Global platform leader | Polymer, software, services | Industrial, healthcare, aerospace |
| 3D Systems | US | Diversified AM provider | Polymer, metal, healthcare | Healthcare, aerospace, industrial |
| EOS | Germany | Industrial AM specialist | Polymer and metal PBF | Aerospace, automotive, industrial |
| Materialise | Belgium | Software/services specialist | AM software, services | Healthcare, industrial |
| Nikon SLM Solutions | Germany/Japan | Metal AM specialist | Metal PBF | Aerospace, automotive, energy |
| HP | US | Production AM challenger | Polymer and metal systems | Industrial production |
| GE Aerospace / Additive | US | Aerospace technology leader | Metal AM | Aerospace |
| Renishaw | UK | Precision AM specialist | Metal systems | Healthcare, aerospace, industrial |
| Formlabs | US | Professional polymer specialist | SLA/SLS | Healthcare, dental, industrial |
| Carbon | US | Digital polymer specialist | DLS/resin systems | Automotive, healthcare, consumer |
| UltiMaker | Netherlands/US | Professional polymer leader | FFF ecosystem | Industrial, education |
| Markforged | US | Composite/industrial specialist | Fiber-reinforced printing | Aerospace, defense, industrial |
| Farsoon | China | Industrial AM challenger | Polymer/metal | Industrial, aerospace |
| BLT | China | Metal AM specialist | Metal PBF | Aerospace, industrial |
| Eplus3D | China | Metal AM challenger | Large-format metal PBF | Aerospace, tooling |
| AddUp | France/US | Industrial metal specialist | PBF/DED | Aerospace, automotive |
| XJet | Israel | Ceramic/metal specialist | NanoParticle Jetting | Medical, electronics |
| Lithoz | Austria | Ceramic AM specialist | Ceramic lithography | Medical, industrial |
| Velo3D | US | Metal production specialist | Metal PBF | Aerospace, energy |
Key Coverage: market positioning, revenue exposure, technology ownership, application concentration, regional footprint, manufacturing capability, strategic activity and emerging challenger analysis.
Market Share & Competitive Ranking
Why is AM Market Share So Specific to Each Technology?
AM market share is split across technologies, materials, and business models, so one consolidated ranking tells readers less than a share by technology. The report estimates shares across total AM revenue, systems, metal systems, polymer systems, materials, software, and services.
For publicly traded firms, disclosures provide informative benchmarks by which to assess performance. For instance, Stratasys, Inc. reports a figure of approximately USD 551 million in FY2025 revenue, of which roughly USD 380 million is attributable to products and USD 171 million is attributable to services, offering a view into the scale of a diversified AM platform. (Stratasys)
Key Coverage
- Top 5 and Top 10 market positions
- Technology-specific market share
- Revenue exposure
- Share gain/loss
- Regional share
- Services versus hardware positioning
- Market concentration
Competitive Benchmarking
Integrated Ecosystems are Emerging as the Core Competitive Advantage
Leading companies are evaluated according to their revenues, ability to scale, profitability, the breadth of technologies, materials, software, installed base, research and development capabilities, patents, geographic reach, production know how, and the range of applications in which they operate.
The three major competitive models are diversified platform providers, technology specialists, and application-focused manufacturers. Platform companies benefit from cross-selling, while the specialists can earn premium prices due to the high switching costs for clients.
Product Portfolio Benchmarking
Do Broad Portfolios or Focused Specialists Win More Business?
Portfolio analysis allows assessing polymer, metal, ceramic, composite, software, materials, and services. It separates the firms that offer a wide range of products across multiple technologies from those that specialize in metal PBF, industrial polymers, dental ceramics, composites, or production software.
The main gaps in the market are high-temperature polymers, recyclable materials, large-format production, automated post-processing, qualified metal alloys, and production-grade software.
Technology & Innovation Benchmarking
Process Productivity and Qualification Matter More Than Printer Specs
Technology benchmarking compares laser count, build volume, deposition rate, resolution, material compatibility, automation, monitoring, software, patents, and commercialization maturity.
The analysis separates technologies that only improve headline print speed from those that actually lower cost per qualified part, which matters far more for industrial adoption.
Application Competitive Benchmarking
Competitive Leadership is Becoming Industry-Specific
Companies are classified according to their applications in the aerospace, defense, healthcare, dental, automotive, industrial, electronics, energy, and consumer industries. The report identifies application specialists and determines their competitive advantage based on technological, certification, customer network, material, or integrated platform solutions.
Key Coverage
- Application leaders
- Industry specialization
- Qualification capability
- Customer penetration
- Application white spaces
Geographic Competitive Landscape
Why is Asia Pacific Gaining Ground in AM Capacity?
Asia Pacific is becoming a pole of growth. Within the region, companies working in the AM space reported an average revenue growth of nearly 19.8% in 2025, compared to 12.6% in the Americas and 9.0% in Europe, the Middle East, and Africa. (Wohlers)
The analysis covers manufacturing, sales, distribution, government-sponsored adoption, aerospace and defense programs, automotive production, and local technological innovations in North America, Europe, and the Asia-Pacific.
Manufacturing & Capacity Benchmarking
Industrialization Depends on Local Production and Reliable Utilization
The report benchmarks production facilities, machine manufacturing, service capacity, installed systems, utilization, capacity additions, and regional localization.
Particular emphasis is placed on whether manufacturers are expanding production capacity, application centers, and service networks in regions where aerospace, automotive, healthcare, and electronics customers are establishing AM production.
Customer & Channel Benchmarking
Technical Support is Becoming a Real Point of Difference
AM equipment is rarely bought on hardware specifications alone. Customers now weigh materials qualification, software integration, application engineering, maintenance, training, workflow compatibility, and production support.
The report benchmarks direct sales, distributors, application centers, technical support, OEM relationships, and customer concentration across leading companies.
Strategic Developments & M&A
Consolidation Targets Technology Breadth and Production-Ready Applications
Recent activity seems to point toward a clear push toward combination in the mix of hardware, software, materials, and application capabilities. The 2025 Desktop Metal acquisition and the restructuring that followed demonstrate the execution risk of consolidation of AM platforms, while the proposed Markforged transaction shows continued interest in composite and industrial production capability. (SEC)
The full report tracks product launches, new facilities, partnerships, joint ventures, technology agreements, acquisitions, and divestitures, and separates consolidation, vertical integration, technology acquisition, and geographic expansion.
Company Profiles
Detailed Intelligence Across the Leading AM Ecosystem
Detailed profiles cover the leading company universe across the points below:
- Corporate structure and headquarters
- AM-relevant revenue and growth
- Product and technology portfolio
- Materials exposure
- Installed base and manufacturing footprint
- R&D and patents
- Geographic presence
- Application exposure
- Major customers and channels
- Strategic investments
- M&A
- Competitive strengths and vulnerabilities
- Future growth priorities
Public company benchmarks are paired with technology, application, and market-position analysis, so AM exposure is not confused with unrelated corporate revenue.
Company Strategic Positioning
Scale Platforms and High-Value Specialists are Taking Different Paths
Companies are positioned qualitatively as Market Leaders, Growth Leaders, Technology Leaders, Scale Leaders, Regional Leaders, Application Specialists, and Emerging Challengers.
The assessment weighs market position, growth, technology differentiation, manufacturing footprint, customer relationships, qualification capability, geographic exposure, and strategic investment, and does not boil the result down to a single score.
Opportunity & White-Space Analysis
Where Does AM Solve a Real Manufacturing Problem?
The best white spaces sit in production aerospace components, patient-specific healthcare products, large-format manufacturing, high-performance polymers, qualified metal alloys, automated post-processing, local spare parts, digital inventory, and production software.
The analysis sizes each through market size, penetration gaps, application growth, import substitution, machine utilization, and cost-reduction potential.
Industry Structure
Qualification and Technical Complexity Create Significant Barriers to Entry
Supplier power is medium to high. Specialized powders, photopolymers, lasers, software, and qualification expertise can create dependency.
Buyer power is medium. Large aerospace, automotive, and industrial customers have leverage, but qualification and switching costs are high.
The threat of new entrants is medium. Desktop printing has low barriers, while industrial metal and certified production need heavy capital, engineering, and validation.
The threat of substitutes is high for mature production runs and lower for complex low-volume work. CNC machining, injection molding, and casting stay strong where volumes and geometries suit them.
Competitive rivalry is high. Many technology platforms compete across overlapping applications, and consolidation adds pressure.
PESTLE Analysis
How Will Policy and Industrial Investment Shape Regional AM Adoption?
- Political: Defense and aerospace policy, manufacturing reshoring, and government incentives.
- Economic: Industrial investment cycles and energy costs.
- Technological: Digital manufacturing standards.
- Legal: Healthcare regulation and intellectual-property protection.
- Environmental: Sustainability requirements.
National industrial policy can shape local AM capacity, qualification infrastructure, strategic materials, and technology development.
Market Attractiveness
High-Value Applications Offer Better Economics Than Undifferentiated Hardware
Market attractiveness is assessed on growth, margin potential, competitive intensity, customer concentration, technology barriers, qualification requirements, capital intensity, and supply-demand conditions.
The analysis separates high-value applications from segments exposed to hardware commoditization and price competition.
Future Outlook
Will Utilization, Automation, and Qualification Define AM's Next Phase?
Through 2035, the market should shift steadily toward production-qualified parts, automated workflows, software-controlled manufacturing, higher machine utilization, advanced materials, and application-specific platforms.
The base case assumes continued double-digit growth, led by services, production applications, healthcare, aerospace and defense, industrial components, and selected automotive uses. The upside case adds faster qualification of production parts, falling cost per part, and stronger adoption of automated systems. The downside case reflects long industrial capex weakness, qualification delays, and continued hardware commoditization.
The deciding question will no longer be who can print a component, but who can make a qualified component again and again at a competitive cost.
Key Coverage
Production-part penetration
- Technology adoption
- Material innovation
- Pricing and margin outlook
- Regional expansion
- Capacity and utilization
- M&A scenarios
- Future profit pools
- Strategic priorities
Key Strategic Questions Addressed
- How large is the global additive manufacturing market in 2025, and how rapidly will it expand through 2035?
- How much of future growth will come from hardware, materials, software, and printing services?
- Which AM technologies are gaining share in industrial production?
- Where does metal AM generate superior economic value versus polymer AM?
- Which applications are moving most rapidly from prototyping into serial production?
- What utilization level is required to achieve competitive cost-per-part economics?
- How are material costs and post-processing affecting AM profitability?
- Which regions are building the strongest production and manufacturing ecosystems?
- Which companies have the broadest technology and application portfolios?
- How concentrated is the market across systems, materials, software, and services?
- Which companies possess meaningful advantages in metal, polymer, software, and specialized applications?
- How is consolidation changing the competitive structure of the industry?
- Where are the largest technology, application, and geographic white spaces?
- What qualification and regulatory barriers will determine future adoption?
Additive Manufacturing Market Segments
By Material
- Metals and Alloys
- Polymers
- Ceramics
- Composites
- Other Materials
By Technology
- Powder Bed Fusion
- Material Extrusion
- Vat Photopolymerization
- Binder Jetting
- Directed Energy Deposition
- Material Jetting
- Other Technologies
By Machine Type
- Industrial 3D Printers
- Professional 3D Printers
- Desktop 3D Printers
By Application
- Prototyping
- Tooling
- Functional Parts
- End-Use Production
- Spare Parts
By End-Use Industry
- Aerospace and Defense
- Healthcare and Dental
- Automotive
- Industrial Machinery
- Electronics
- Energy
- Consumer Products
- Education
- Other Industries
By Business Model
- Equipment Sales
- Material Sales
- Software Licensing
- Printing Services
- Contract Manufacturing
By Printer Price Class
- Low-Cost
- Mid-Range
- High-End Industrial Systems
By Region
- North America
- Europe
- Asia Pacific
- Latin America
- The Middle East and Africa
For inquiries regarding discounts, bulk purchases, or customization requests, please contact us at sales@precedenceresearch.com
Frequently Asked Questions





Ask For Sample
No cookie-cutter, only authentic analysis – take the 1st step to become a Precedence Research client
 Get a Sample




 sales@precedenceresearch.com
 Schedule a Meeting