


Carbon Capture Utilization Storage Market Size, Share and Forecast 2026–2035: Capture Plants, CO2 Transport Networks and Offshore Storage Hubs Scale Up for Industrial Decarbonization
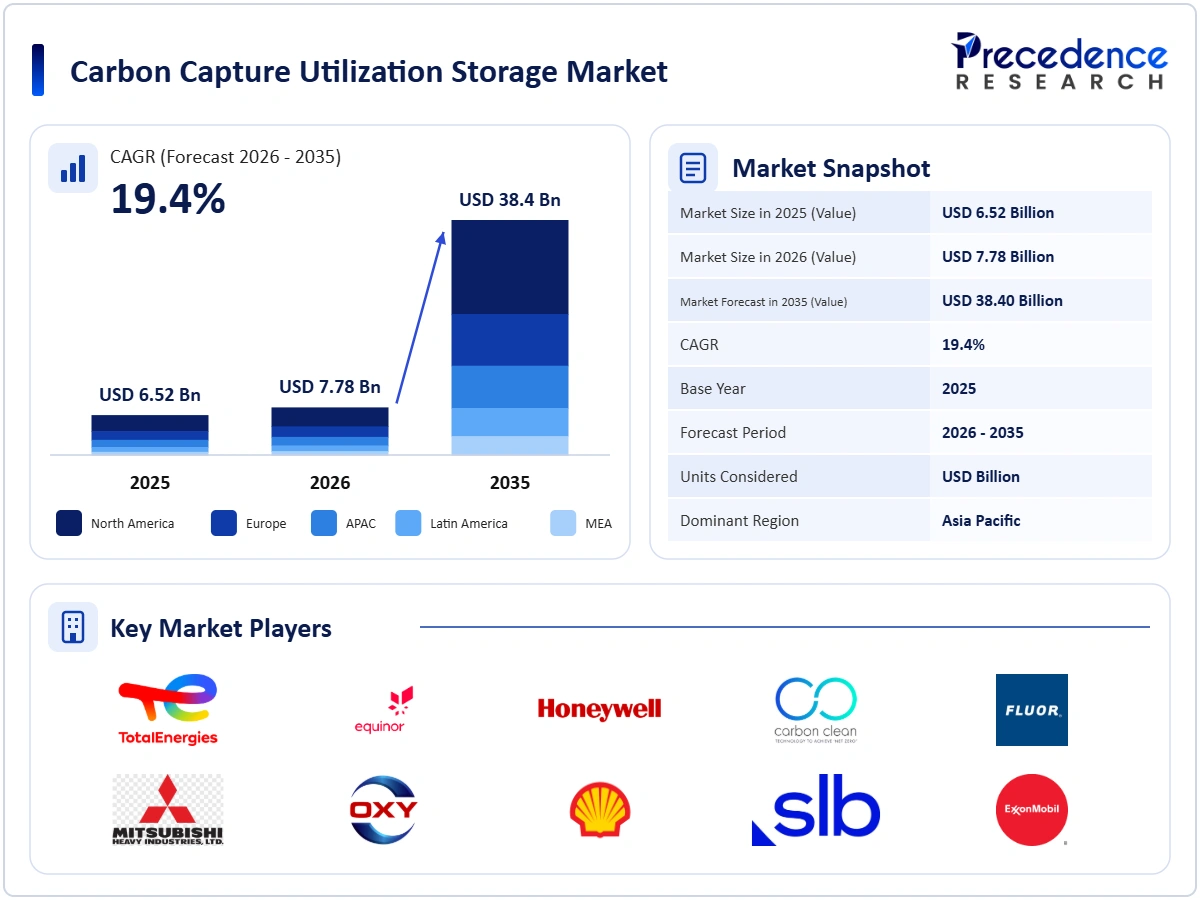
The carbon capture utilization storage market is estimated at USD 7.78 billion in 2026 and is projected to reach USD 38.40 billion by 2035, expanding at a CAGR of 19.40% from 2026 to 2035. The carbon capture utilization storage market was valued at USD 6.52 billion in 2025, the base year. The report covers technologies, equipment and services to capture carbon dioxide from industrial facilities, power plants and the atmosphere, compress and transport it by pipeline or ship, and either store it permanently in geological formations or use it in enhanced oil recovery, chemicals, fuels, building materials and other products, including capture plants, compression and dehydration, transport infrastructure, injection wells, monitoring and related engineering and operations. Capture accounted for the largest reported service share in 2025, at 56.4%. North America accounted for 46.2% of reported market revenue, supported by US Section 45Q tax incentives, industrial capture projects, COâ‚‚ pipeline networks and storage developments. Eligibility for tax incentives depends on applicable statutory requirements and project-specific conditions. Industrial decarbonization, carbon pricing, government incentives, and the development of shared transport and storage infrastructure are driving the demand for CCUS facilities.
Source: https://www.precedenceresearch.com/carbon-capture-utilization-storage-market
 Get a Sample
 Table Of Content


Key Takeaways
Market Size & Growth Outlook
- Market size in 2025: USD 6.52 billion
- Estimated market size in 2026: USD 7.78 billion
- Projected market size by 2035: USD 38.40 billion
- CAGR (2026–2035): 19.4%
Regional Market Spotlight
- North America led the market with a 46.2% (USD 3.01 billion) share in 2025.
- Europe accounted for 26.8% (USD 1.75 billion) of the market in 2025.
- Asia Pacific accounted for 16.4% (USD 1.07 billion) of the market in 2025 and is projected to be the fastest-growing region, at a CAGR of 21.63% from 2025 to 2035.
Segmental Spotlight
- By service, Capture accounted for 56.4% (USD 3.68 billion) in 2025.
- By technology, Post-Combustion accounted for 48.6% (USD 3.17 billion) in 2025.
- By application, Natural Gas Processing & Hydrogen accounted for 28.4% (USD 1.85 billion) in 2025.
- By end use, Dedicated Geological Storage accounted for 48.2% (USD 3.14 billion) in 2025.
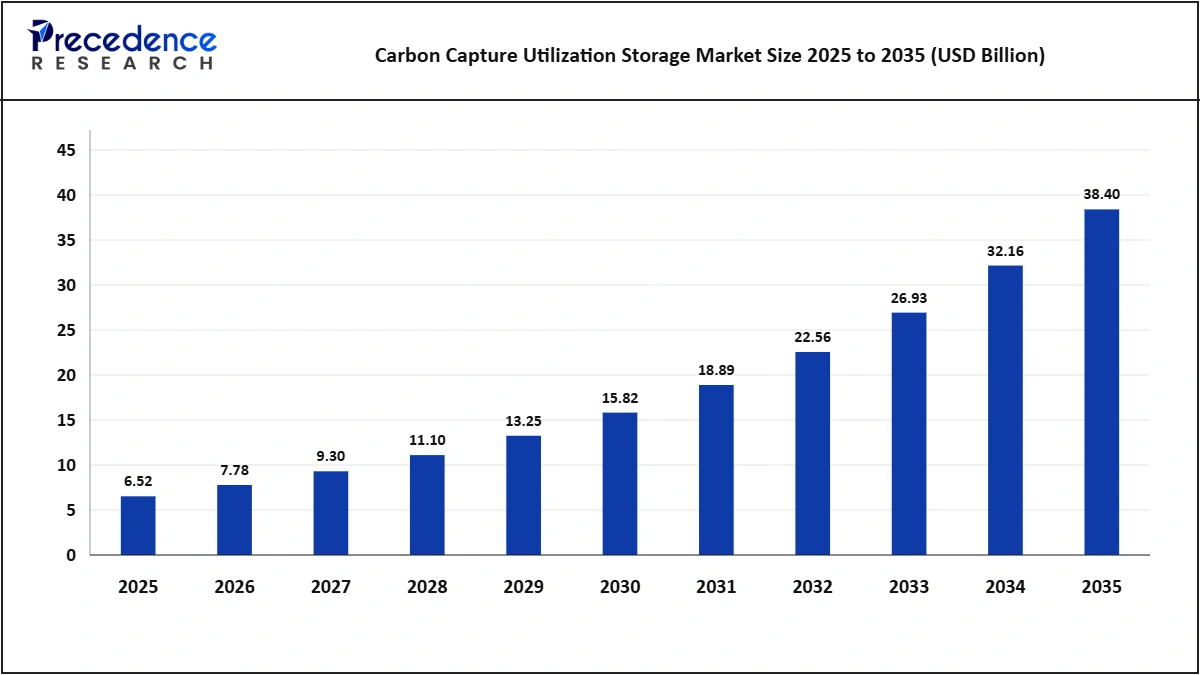
Carbon Capture Utilization Storage Market Size and Forecast, 2025-2035 (USD Billion)
Sources: Expert interviews, secondary sources, Precedence Research database, and Precedence Research analysts.
The carbon capture utilization storage market is projected to grow from USD 6.52 billion in 2025 to USD 38.4 billion by 2035 because companies in hard-to-abate sectors need carbon capture and storage to cut emissions where alternatives are limited, and governments support projects through credits and carbon pricing. Shared transport and storage hubs lower costs and open CCUS to smaller emitters, lifting the market to USD 15.82 billion by 2030 and sustaining a CAGR of 19.4% from 2026 to 2035.
- Analyst View: We built the estimate from annual spending on CCUS projects by stage, capture, transport, storage, and utilization, based on operating and under-construction capture capacity, capital cost per ton, and operating and service revenue, by region and application. Project pipelines reflect gas processing, ethanol, hydrogen, cement, steel, power, waste-to-energy, and direct air capture. The base-year estimate was compared with published market estimates, accounting for differences in market scope, revenue definitions, and base years. The growth rate reflects strong project pipelines, moderated by delays, cost overruns, and policy risk, so we use a lower rate than the most aggressive estimates.
Market Trends
- Open-access storage hubs begin operating.
- Cement and steel adopt capture.
- CO2 shipping links emitters to offshore storage.
- Direct air capture deployment may expand as carbon removal markets develop, although costs, energy requirements and financing remain significant constraints.
- Class VI storage permits expand in the US.
- Integrated capture-to-storage services grow.
Drivers, Restraints and Opportunities
Driver
Net-zero commitments require capture in hard-to-abate industries. Incentives such as the US 45Q credit and EU carbon pricing improve economics. Shared transport and storage hubs reduce costs for emitters. Low-carbon hydrogen, fuels and materials markets reward captured CO2. Direct air capture is supported by carbon removal demand.
Restraint
Capture remains costly, especially for dilute flue gases. Projects face long permitting and development timelines. Policy changes can affect incentives. Public opposition to pipelines and storage can delay projects. Cost overruns and technical risks have affected some projects.
Opportunity
Cement, steel and waste-to-energy capture create large new markets. Cross-border CO2 shipping can connect Asian emitters to storage. CO2 utilization in fuels and materials can add revenue. Storage hubs in the Middle East and Asia offer growth. Monitoring and verification services grow with stored volumes.
Market Segmentation: 2025 Share and Value
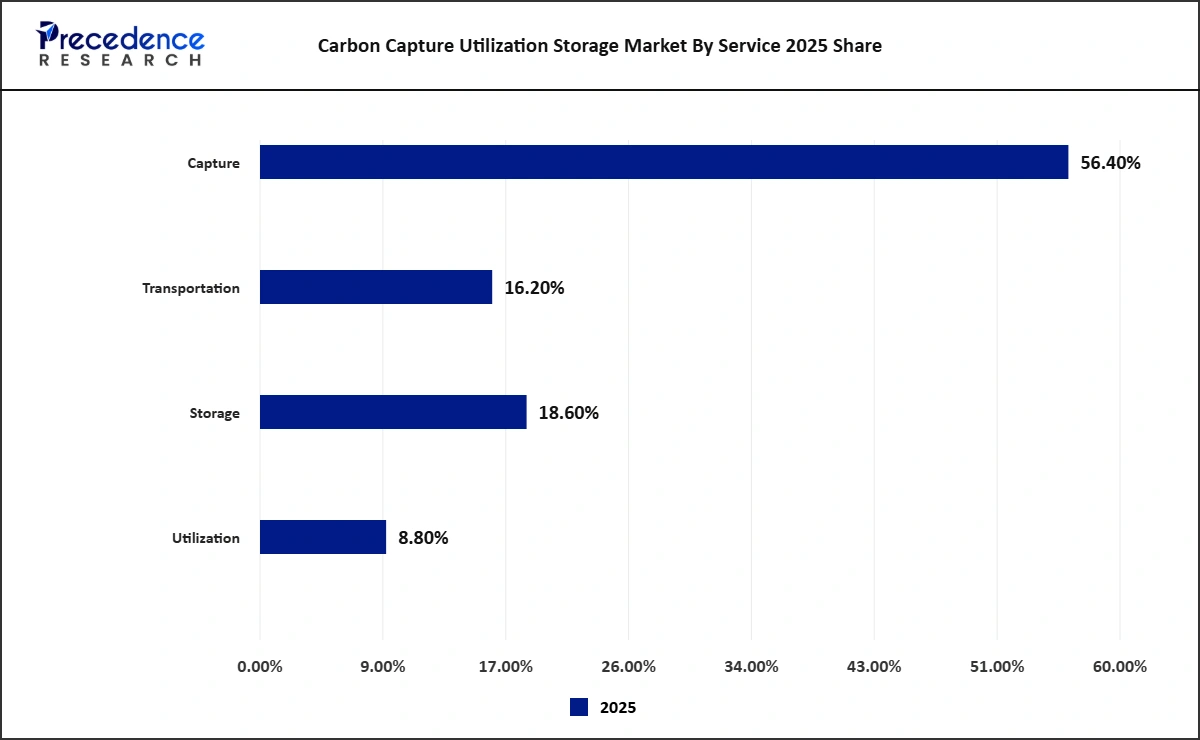
Carbon Capture Utilization Storage Market by Service 2025 Share & Size
Sources: Expert interviews, secondary sources, Precedence Research database and Precedence Research analysts.
Capture accounted for 56.4% (USD 3.68 billion) in 2025 because capture units, solvents and compression equipment represent most of the capital cost of CCUS projects, especially for dilute post-combustion streams. Storage, at 18.6% (USD 1.21 billion), includes site characterization, injection wells and monitoring, and is the fastest-growing service as dedicated storage hubs come online. Transportation accounts for 16.2% (USD 1.06 billion), covering pipelines and CO2 shipping, and utilization accounts for 8.8% (USD 0.57 billion).
Carbon Capture Utilization Storage Market by Technology 2025 Share & Size
| Segments | 2025 Share | 2025 Market Value |
| Post-Combustion | 48.6% | USD 3.17 billion |
| Pre-Combustion | 24.2% | USD 1.58 billion |
| Oxy-Fuel Combustion | 6.4% | USD 0.42 billion |
| Direct Air Capture | 8.4% | USD 0.55 billion |
| Industrial Separation & Others | 12.4% | USD 0.81 billion |
Note: 2025 is the base year.
Sources: Expert interviews, secondary sources, Precedence Research database and Precedence Research analysts.
Post-combustion capture accounted for 48.6% (USD 3.17 billion) in 2025 because it can be retrofitted to existing power, cement and industrial plants using amine solvents. Pre-combustion capture accounts for 24.2% (USD 1.58 billion), mainly in gas processing and hydrogen production. Direct air capture, at 8.4% (USD 0.55 billion), is the fastest-growing technology, supported by carbon removal markets. Oxy-fuel combustion accounts for 6.4% (USD 0.42 billion) and industrial separation and others for 12.4% (USD 0.81 billion).
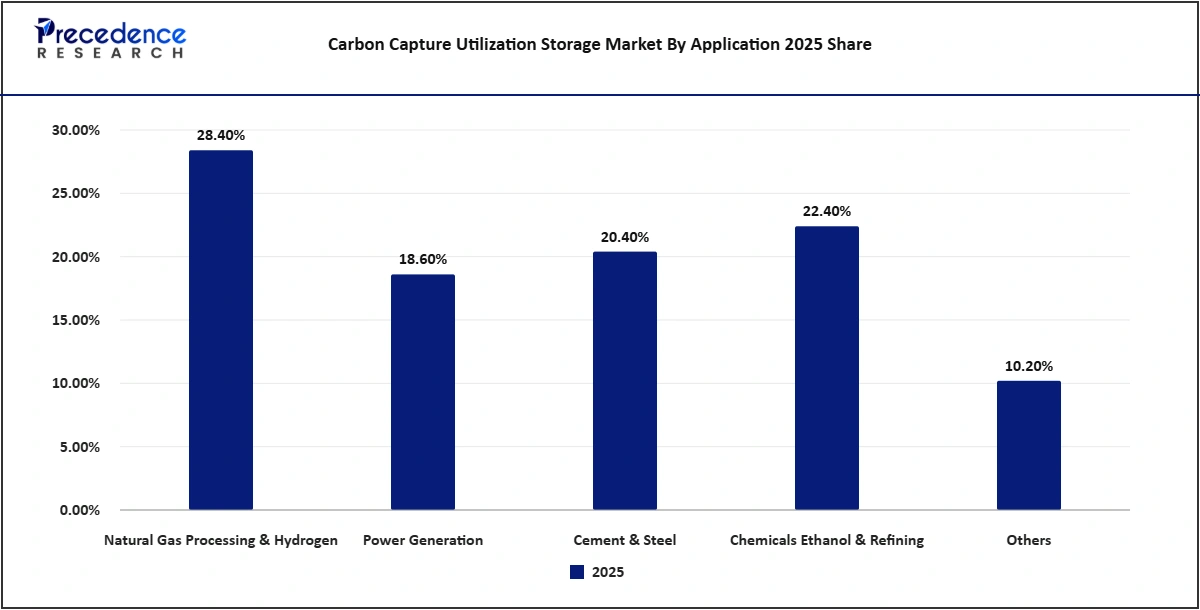
Carbon Capture Utilization Storage Market by Application 2025 Share & Size
Sources: Expert interviews, secondary sources, Precedence Research database and Precedence Research analysts.
Natural gas processing and hydrogen accounted for 28.4% (USD 1.85 billion) in 2025 because CO2 separation is inherent in these processes and capture costs are lowest. Chemicals, ethanol and refining account for 22.4% (USD 1.46 billion), cement and steel for 20.4% (USD 1.33 billion), power generation for 18.6% (USD 1.21 billion) and others for 10.2% (USD 0.67 billion). Cement and steel represent important potential growth areas as industrial facilities pursue emissions reductions. Their growth ranking requires comparative application forecasts.
Carbon Capture Utilization Storage Market by End Use 2025 Share & Size
| Segments | 2025 Share | 2025 Market Value |
| Dedicated Geological Storage | 48.2% | USD 3.14 billion |
| Enhanced Oil Recovery | 36.4% | USD 2.37 billion |
| CO2 Utilization (Chemicals, Fuels & Materials) | 15.4% | USD 1.00 billion |
Note: 2025 is the base year.
Sources: Expert interviews, secondary sources, Precedence Research database and Precedence Research analysts.
Dedicated geological storage accounted for 48.2% (USD 3.14 billion) in 2025 and is the fastest-growing end use as saline aquifer storage hubs open in Europe and North America. Enhanced oil recovery accounts for 36.4% (USD 2.37 billion), and CO2 utilization in chemicals, fuels and materials accounts for 15.4% (USD 1.00 billion).
- Analyst View: Segment values were allocated by matching project capacity, capital and operating costs to services, technologies, applications and end uses, using engineering and operator data. Capture leads because of its capital intensity, and gas processing and hydrogen lead because capture there is lowest cost. We expect storage, direct air capture, cement and steel and dedicated storage to gain share.
Regional Analysis
Carbon Capture Utilization Storage Market by Region 2025 Share & Size
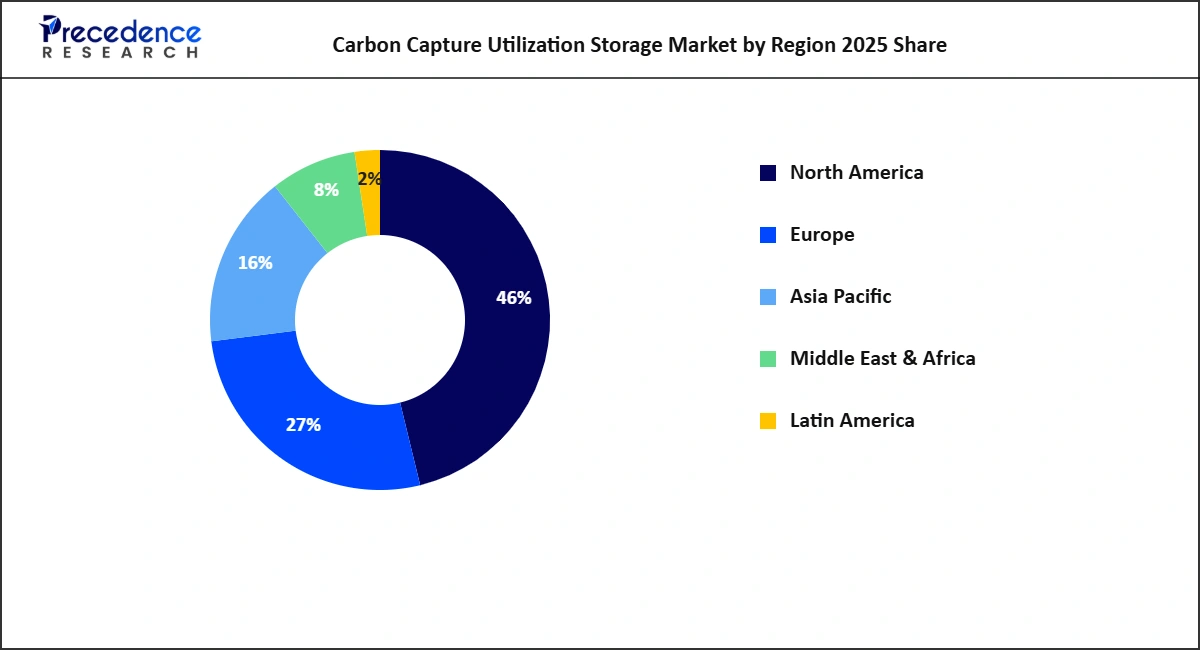
Sources: Expert interviews, secondary sources, Precedence Research database and Precedence Research analysts.
North America accounted for 46.2% (USD 3.01 billion) in 2025, supported by the 45Q tax credit, large ethanol and gas processing capture, CO2 pipeline networks, Class VI storage permits and Canadian projects. Europe, at 26.8% (USD 1.75 billion), is supported by EU carbon pricing, offshore storage hubs in Norway, the Netherlands, Denmark and the United Kingdom and cement and waste-to-energy capture. Asia Pacific, at 16.4% (USD 1.07 billion), is the fastest-growing region, supported by projects in China, Australia, Japan, South Korea, Malaysia and Indonesia. The Middle East and Africa, at 8.2% (USD 0.53 billion), is supported by capture at gas and hydrogen facilities in Saudi Arabia, the UAE and Qatar, and Latin America, at 2.4% (USD 0.16 billion), by Brazilian offshore CO2 reinjection.
North America accounted for 46.2% (USD 3.01 billion) in 2025. The 45Q credit supports capture of ethanol plants, gas processing and hydrogen projects. Gulf Coast and Midwest storage hubs are being developed. Direct air capture hubs are under construction.
Europe accounted for 26.8% (USD 1.75 billion) in 2025. Northern Lights in Norway began injecting CO2 from Heidelberg Materials' Brevik cement plant in August 2025 and approved a second phase to raise capacity above 5 million tons per year from 2028. The Netherlands, Denmark and the United Kingdom are developing storage hubs.
Asia Pacific accounted for 16.4% (USD 1.07 billion) in 2025 and is the fastest-growing region. China operates capture projects in power and chemicals. Japan and South Korea plan cross-border CO2 shipping to storage sites in Southeast Asia and Australia. Malaysia and Indonesia are developing storage.
The Middle East and Africa accounted for 8.2% (USD 0.53 billion) in 2025. Saudi Arabia, the UAE and Qatar capture CO2 at gas and industrial facilities. Large hubs are planned.
Latin America accounted for 2.4% (USD 0.16 billion) in 2025. Petrobras reinjects CO2 from offshore pre-salt fields. Brazil is developing a regulatory framework for storage.
Analyst View: Regional shares were built from project capacity, spending, and service revenue in each region. North America leads because of tax credits and operating projects. We assign Asia Pacific the highest growth premium because project pipelines are expanding fastest there from a lower base.
Top 10 Companies in the Carbon Capture Utilization Storage Market
| Rank | Company Name | Market-Specific Revenue (USD Billion) | 2025 Share | Key Products / Business | Headquarters |
| 1 | ExxonMobil | 0.52 | 7.98% | CO2 capture, pipelines and storage | United States |
| 2 | SLB | 0.38 | 5.83% | Storage characterisation and capture technology | United States |
| 3 | Equinor | 0.30 | 4.60% | Northern Lights and CCS projects | Norway |
| 4 | Shell | 0.28 | 4.29% | Cansolv capture and CCS projects | United Kingdom |
| 5 | Occidental (1PointFive) | 0.26 | 3.99% | Direct air capture and storage | United States |
| 6 | Mitsubishi Heavy Industries | 0.24 | 3.68% | KM CDR capture technology | Japan |
| 7 | Fluor | 0.20 | 3.07% | Econamine capture engineering | United States |
| 8 | Carbon Clean | 0.18 | 2.76% | Modular CycloneCC capture units | United Kingdom |
| 9 | TotalEnergies | 0.16 | 2.45% | Northern Lights and storage projects | France |
| 10 | Honeywell | 0.14 | 2.15% | Capture technologies | United States |
Note: Company revenues and shares are 2025 estimates.
Sources: Company press releases, expert interviews, secondary sources, Precedence Research database and Precedence Research analysts.
ExxonMobil led the carbon capture utilization storage market with an estimated 7.98% (USD 0.52 billion) of 2025 revenue, followed by SLB at 5.83% (USD 0.38 billion) and Equinor at 4.60% (USD 0.30 billion). ExxonMobil leads because it operates large CO2 capture, pipeline and storage assets in the United States, including the CO2 pipeline network acquired with Denbury, and offers end-to-end CCS services to industrial emitters. SLB provides storage characterization, monitoring and capture technology, including through SLB Capturi, and Equinor leads European storage development as operator of Northern Lights with Shell and TotalEnergies. Shell, Occidental's 1PointFive, Mitsubishi Heavy Industries, Fluor, Carbon Clean, TotalEnergies and Honeywell compete through capture technology licensing, engineering, direct air capture and storage project development.
The top 10 companies accounted for an estimated 40.8% (USD 2.66 billion) of 2025 revenue, while the remaining 59.2% (USD 3.86 billion) was shared among engineering contractors, capture technology start-ups, pipeline operators and storage developers. The carbon capture utilization storage market is fragmented across capture technology providers, engineering firms, energy companies and storage operators, and competition focuses on cost per ton, project delivery, storage capacity and permits, technology performance and access to incentives. Integrated players that combine capture, transport and storage are gaining advantage, while shared hubs open the market to more emitters.
Recent Developments
- March 2025: Equinor, Shell and TotalEnergies took a final investment decision on phase 2 of the Northern Lights CCS project, investing about NOK 7.5 billion to raise transport and storage capacity from 1.5 million to over 5 million tons of CO2 per year from 2028.
- August 2025: Northern Lights injected its first CO2 into the Aurora reservoir off western Norway, marking the operational start of the first open-access cross-border CO2 transport and storage service, with CO2 from Heidelberg Materials' Brevik cement plant.
Market Segments
By Service
- Capture
- Transportation
- Storage
- Utilization
By Technology
- Post-Combustion
- Pre-Combustion
- Oxy-Fuel Combustion
- Direct Air Capture
- Industrial Separation & Others
By Application
- Natural Gas Processing & Hydrogen
- Power Generation
- Cement & Steel
- Chemicals, Ethanol & Refining
- Others
By End Use
- Dedicated Geological Storage
- Enhanced Oil Recovery
- CO2 Utilization (Chemicals, Fuels & Materials)
By Region
- North America (U.S., Canada, Mexico)
- Europe (Germany, U.K., France, Italy, Spain, Rest of Europe)
- Asia Pacific (China, Japan, India, South Korea, Taiwan, Rest of Asia Pacific)
- Latin America (Brazil, Argentina, Rest of Latin America)
- Middle East & Africa (GCC, South Africa, Rest of MEA)
Research Methodology
The CCUS market was defined as the worldwide market for COâ‚‚ capture, transportation, storage and utilization equipment, infrastructure and services. The 2025 base-year estimate was developed using project capacity, attributable equipment and service contracts, and operating revenue, with cross-checks against company disclosures, regulatory information, industry data, and published market estimates.
Capital expenditure was used as an estimation input and was not added separately where the same economic activity was already represented in equipment or engineering revenue. Segment values were allocated using documented classification rules for services, technologies, applications, and end uses. Overlapping transactions were excluded from the total market estimate.
The 2026–2035 forecast was calculated using the stated annual growth assumptions. The reported CAGR was calculated separately from the 2026 and 2035 market estimates. All segment and regional values should be reconciled against the same 2025 base-year total using unrounded data before publication.
Analyst View: Overall Market
The carbon capture utilization storage market is at an early scale-up stage, with open-access storage now operating and project pipelines growing across industries. Our estimate links demand to capture capacity, capital and operating costs and service revenue, so the forecast follows project deployment, incentives and infrastructure. The main upside comes from storage hubs and industrial capture, while the main risks are project delays, costs, and policy changes.
Sources and References
- World Oil. "TotalEnergies, partners launch $700 million expansion of Northern Lights CCS project". 2025-03-27. Northern Lights phase 2 FID. https://worldoil.com/news/2025/3/27/totalenergies-partners-launch-700-million-expansion-of-northern-lights-ccs-project/
- Oil & Gas Journal. "Northern Lights achieves first injection, storage of CO2 volumes in North Sea". 2025-08-25. Northern Lights first injection. https://ogj.com/energy-transition/news/55312049/northern-lights-achieves-milestone-with-first-co2-injection-in-north-sea
- Energy Institute. "On the horizon: Norwegian CCUS vision soon to be made real". 2024-08-14. Longship program. https://knowledge.energyinst.org/new-energy-world/article?id=138987
For inquiries regarding discounts, bulk purchases, or customization requests, please contact us at sales@precedenceresearch.com
Frequently Asked Questions





Ask For Sample
No cookie-cutter, only authentic analysis – take the 1st step to become a Precedence Research client
 Get a Sample




 sales@precedenceresearch.com
 Schedule a Meeting