Middle East Industrial Packaging Market Size is USD 10.39 Billion in 2026
Middle East Industrial Packaging Market (By Material: Metal-based Nanocatalysts, Metal Oxide Nanocatalysts, Carbon-based Nanocatalysts, Polymeric Nanocatalysts, Composite Nanocatalysts; By Application: Petroleum Refining, Chemicals, Environmental, Energy & Fuel Cells, Automotive, Electronics & Semiconductor, Food & Beverage, Pharmaceuticals & Biotechnology) Industry Size, Share, Growth, Trends 2026 to 2035.


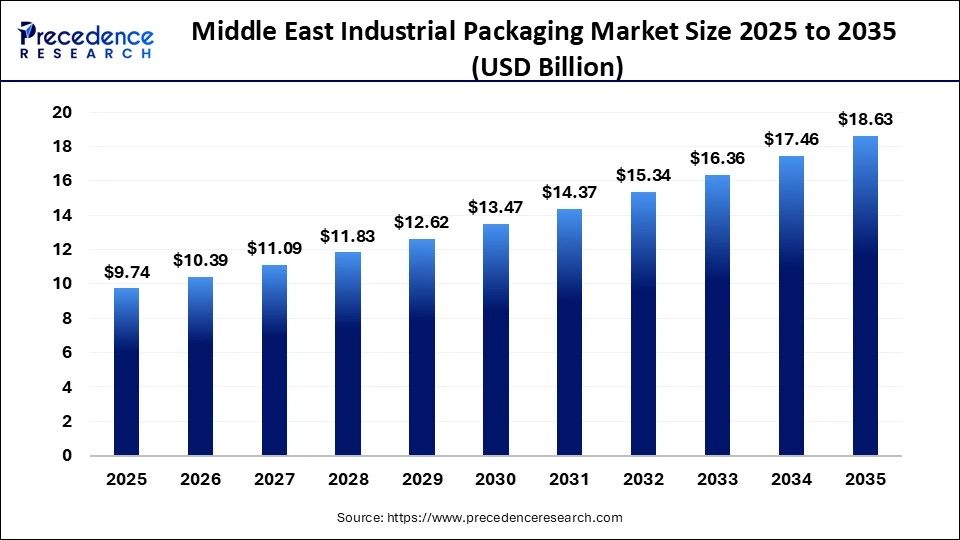
The Middle East industrial packaging market size was estimated at USD 9.74 billion in 2025 and is expanding at a CAGR of 6.7% from 2026 to 2035. Due to rapid industrialization, expanding logistics and commerce sectors, and increasing demand from oil, gas, and manufacturing industries, rising exports and infrastructure development require durable and efficient packaging solutions for the tribes.
Middle East Industrial Packaging Market Statical Scope
| Reports Attributes | Statistics |
| Market Size in 2025 | USD 9.74 Billion |
| Market Size in 2026 | USD 10.39 Billion |
| Market Size by 2035 | USD 18.63 Billion |
| CAGR 2026 to 2035 | 6.7% |
| Base Year | 2025 |
| Forecast Period | 2026 to 2035 |
Technological advancements in the Middle East industrial packaging market are driven by automation, smart packaging, and sustainability-focused innovations as manufacturers are adopting AI-enabled robotics systems Integration , robotics, and robot-integrated machinery to improve efficiency, reduce labor costs, and enhance production speed. Intelligent packaging solutions such as RFID, text QR codes, and sensors are increasingly used for real-time tracking of product authentication and quality monitoring.
Additionally, eco-friendly materials are energy-efficient processes and are gaining importance due to regulatory and environmental pressures encouraging the shift towards sustainable packaging technologies.
Middle East Industrial Packaging Market Share, By Country, 2025 (%)
- UAE- Due to expansion supported by strong growth in manufacturing, logistics, and export-oriented industries such as chemicals and pharmaceutical , government initiatives like operations and rising demand for sustainable packaging solutions to boost market development, alongside increasing e-commerce and trade activities.
- Saudi Arabia- Driven by expanding petrochemical construction and manufacturing sectors, the government is boosting industrial output and logistics infrastructure, rising exports, and increasing demand for durable, cost-efficient packaging solutions are further supporting market expenditure across the country.
Middle East Industrial Packaging Market Share, By Technology, 2025 (%)
| Segments | Shares (%) |
| Plastic | 51% |
| Metal | 18% |
| Wood | 14% |
| Glass | 7% |
| Foam | 10% |
- Plastic- The segment dominated the market with a 51% share, due to its lightweight nature, durability, cost-effectiveness, and versatility. It is widely used across the logistics, chemicals, and food industries for efficient handling and transportation.
- Metal- The segment accounted for 18% of the total market share, due to its strength, durability, and ability to safely store hazardous chemicals, oil, and heavy industrial materials.
- Wood- The segment accounted for 14% of the total market share, due to its strength, reusability, and suitability for heavy-duty transport, especially in machinery construction and export logistics.
- Glass- The segment accounted for 7% of the total market share, because it offers chemical resistance and product visibility, making it ideal for pharmaceuticals, beverages, and specialty chemical packaging.
- Foam- The segment accounted for 10% of the total market share, due to its lightweight cushioning, shock absorption, and protective properties, making it ideal for protective goods during stores and transportation.
Middle East Industrial Packaging Market Share, By Power Capacity, 2025 (%)
| Segments | Shares (%) |
| Pallets | 35% |
| Crates | 14% |
| Intermediate Bulk Containers (IBCs) | 12% |
| Drums & Barrels | 16% |
| Dunnage | 10% |
| Pails | 13% |
- Pallets- The segment dominated the market with a 35% share, due to its efficiency in handling, storing, and transporting bulk goods, reducing labor costs, and improving supply chain logistics.
- Crates- The segment accounted for 14% of the total market share, because it provides sturdy reusable storage and transport solutions, particularly for agricultural products and industrial goods.
- Intermediate Bulk Containers (IBCs)- The segment accounted for 12% of the total market share, due to its large capacity, durability, and efficiency in storing and transporting liquids, chemicals, and granular materials.
- Drums & Barrels- The segment accounted for 16% of the total market share, because it offers secure, durable storage and transport for liquids, chemicals, and bulk materials across industries.
- Dunnage- The segment accounted for 10% of the total market share, due to its role in protecting goods, preventing damage during transits, and optimizing space in shipping and storage operations.
- Pails- The segment accounted for 13% of the total market share, because it provides convenient, durable, and reusable solutions for storing and transporting liquids, powders, and chemicals safely and efficiently.
Middle East Industrial Packaging Market Share, By End Use, 2025 (%)
| Segments | Shares (%) |
| Automotive | 28% |
| Electrical & Electronics | 15% |
| E-Commerce | 24% |
| Chemicals & Pharmaceuticals | 33% |
- Automotive- The segment accounted for 28% of the total market share, due to growing vehicle manufacturing and spare part production requiring robust protective and efficient packaging solutions for safe transportation.
- Electrical & Electronics- The segment accounted for 15% of the total market share, because it demands protective shock-absorbing and anti-static packaging to ensure safe storage and transportation of sensitive devices.
- E-Commerce- The segment accounted for 24% of the total market share, due to the rapid growth of online retail requiring efficient, lightweight, and protective packaging for safe and timely delivery.
- Chemicals & Pharmaceuticals- The segment dominates the market with a 33% share, because these industries require safe, durable, compliant packaging for transporting hazardous chemicals and sensitive pharmaceutical products.
Top Companies in the Middle East Nanocatalysts Market
- Takween Advanced Industries
- IPLAST (I-Plast Ltd.)
- PPC
- Saudi Plastic Packaging Systems CO.LTD
- Saudi Arabian Packaging Industry WLL (SAPIN)
- Arabian Plastics Industrial Company Limited (APICO)
- National Plastic Factory LLC
- GhanPlastco
- SPF
- Al Nawakheth Factory Company
- KANR For Plastic Industries
- Colorful Sun Foundation
- Arnon Plastic Industry Co. Ltd. (Bawan)
- Napco Group (Napco National)
- Sealed Air Corporation (Sealed Air Saudi Arabia)
Segments Covered in the Report
By Material
- Plastic
- Metal
- Wood
- Glass
- Foam
By Product
- Pallets
- Crates
- Intermediate Bulk Containers (IBCs)
- Drums & Barrels
- Dunnage
- Pails
- Others
By End Use
- Automotive
- Electrical & Electronics
- E-commerce
- Chemicals & Pharmaceuticals
- Others
| Product | 2025 | 2026 | 2027 | 2028 | 2029 | 2030 | 2031 | 2032 | 2033 | 2034 | 2035 |
|---|---|---|---|---|---|---|---|---|---|---|---|
| Pallets | 2.14 | 2.27 | 2.40 | 2.54 | 2.69 | 2.84 | 3.01 | 3.18 | 3.36 | 3.56 | 3.76 |
| Crates | 1.17 | 1.25 | 1.33 | 1.42 | 1.52 | 1.62 | 1.73 | 1.85 | 1.98 | 2.11 | 2.26 |
| IBCs | 1.75 | 1.89 | 2.04 | 2.21 | 2.38 | 2.57 | 2.78 | 3.00 | 3.23 | 3.49 | 3.76 |
| Drums & Barrels | 1.95 | 2.07 | 2.20 | 2.34 | 2.48 | 2.64 | 2.81 | 2.98 | 3.17 | 3.36 | 3.58 |
| Dunnage | 0.97 | 1.04 | 1.11 | 1.19 | 1.27 | 1.35 | 1.45 | 1.54 | 1.65 | 1.76 | 1.88 |
| Pails | 0.88 | 0.94 | 1.00 | 1.07 | 1.14 | 1.22 | 1.30 | 1.39 | 1.48 | 1.59 | 1.69 |
| Others | 0.88 | 0.94 | 1.00 | 1.07 | 1.14 | 1.22 | 1.30 | 1.39 | 1.48 | 1.59 | 1.69 |
| End Use | 2025 | 2026 | 2027 | 2028 | 2029 | 2030 | 2031 | 2032 | 2033 | 2034 | 2035 |
|---|---|---|---|---|---|---|---|---|---|---|---|
| Automotive | 1.75 | 1.85 | 1.96 | 2.07 | 2.19 | 2.31 | 2.44 | 2.58 | 2.73 | 2.88 | 3.04 |
| Electrical & Electronics | 1.56 | 1.67 | 1.79 | 1.92 | 2.06 | 2.21 | 2.37 | 2.54 | 2.73 | 2.92 | 3.14 |
| E-commerce | 2.14 | 2.31 | 2.50 | 2.70 | 2.92 | 3.15 | 3.40 | 3.67 | 3.96 | 4.27 | 4.61 |
| Chemicals & Pharmaceuticals | 2.73 | 2.89 | 3.07 | 3.25 | 3.44 | 3.65 | 3.87 | 4.10 | 4.35 | 4.61 | 4.89 |
| Others | 1.56 | 1.66 | 1.77 | 1.89 | 2.01 | 2.14 | 2.28 | 2.44 | 2.60 | 2.77 | 2.95 |
Research Methodology
Related Databooks
March 2026
March 2026
April 2026
April 2026

 sales@precedenceresearch.com
 +1 804-441-9344
 Download Databook
 Schedule a Meeting