North America Anime Market Size is USD 5.19 Billion in 2026
North America Anime Market (By Type: T.V., Movie, Video, Internet Distribution, Merchandising, Music, Pachinko, and Live Entertainment; By Genre: Action & Adventure, Sci-Fi & Fantasy, Romance & Drama, Sports, and Others) Industry Size, Share, Growth, Trends 2026 to 2035.


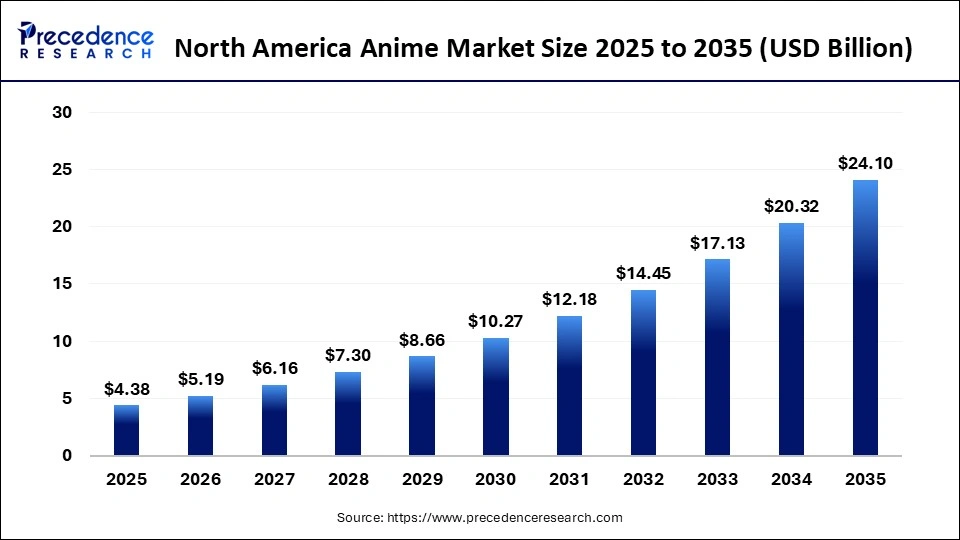
The North American anime market is expected to grow from USD 4.38 billion in 2025, with a satisfying CAGR of 18.6%. Growing due to streaming platforms advanced animation, global pop culture influence, social media engagement, merchandise demand, studio collaborations, and diverse genres, attracting a wide loyal and expanding audience worldwide.
North America Anime Market Statical Scope
| Reports Attributes | Statistics |
| Market Size in 2025 | USD 4.38 Billion |
| Market Size in 2026 | USD 5.19 Billion |
| Market Size by 2035 | USD 24.10 Billion |
| CAGR 2026 to 2035 | 18.6% |
| Base Year | 2025 |
| Forecast Period | 2026 to 2035 |
Technological advancements are transforming the anime industry by enhancing production quality and visual appeal. Modern animation software, CGI, and digital tools allow studios to create more detailed, immersive, and dynamic content. These innovations attract both dedicated fans and new audiences, increase engagement, and enable faster, more cost-effective production. As a result, technology is a key driver of the anime market's growth, expanding its reach and influence globally.
North America Anime Market Share, By Type, 2025 (%)
| Segments | Shares (%) |
| T.V. | 12% |
| Movie | 10% |
| Video | 8% |
| Internet Distribution | 24% |
| Merchandising | 18% |
| Music | 7% |
| Pachinko | 6% |
| Live Entertainment | 15% |
- T.V.- The segment accounted for 12% of the total market share. TV broadcasting is gradually losing ground to digital platforms that offer on-demand content.
- Movie- The segment accounted for 10% of the total market share. Anime films have a dedicated fan following, but their releases are less frequent compared to series formats.
- Video- The segment accounted for 8% of the total market share. Physical and Standalone video formats are declining as digital streaming becomes the preferred choice for consumers.
- Internet Distribution- The segment dominated the market with a 24% share. Its growth is driven by streaming platforms that provide convenient access, worldwide availability, and on-demand anime content.
- Merchandising- The segment accounted for 18% of the total market share. Growth is driven by rising fan engagement, which fuels demand for collectibles, apparel, and other anime-themed products.
- Music- The segment accounted for 7% of the total market share. Anime soundtracks and theme songs maintain a loyal yet limited fan base.
- Pachinko- The segment accounted for 6% of the total market share. Its presence is confined to a niche segment, limiting exposure outside select markets.
- Live Entertainment- The segment accounted for 15% of the total market share; its growth is gradual yet consistent, fueled by events and conventions that attract and nurture growing fan communities.
North America Anime Market Share, By Genre, 2025 (%)
| Segments | Shares (%) |
| Action & Adventure | 34% |
| Sci-Fi & Fantasy | 26% |
| Romance & Drama | 16% |
| Sports | 12% |
| Others | 12% |
- Action & Adventure- The segment dominated the market with a 34% share, driven by mass appeal, engaging content, and a wide fan base spanning multiple age groups.
- Sci-Fi & Fantasy- The segment accounted for 26% of the total market share. Growth is fueled by the audience's rising interest in futuristic themes, expansive world-building, and visually immersive storytelling.
- Romance & Drama- The segment accounted for 16% of the total market share. It remains niche yet strong thanks to a dedicated fan base attracted by emotionally engaging storylines.
- Sports- The segment accounted for 12% of the total market share. It remains a favourite among viewers who enjoy inspiring and competition-driven narratives despite not leading the market.
- Others- The segment accounted for 12% of the total market share. It represents a niche genre that caters to a specific audience.
Top Companies in the North America Anime Market
- Crunchyroll (Sony Pictures Entertainment Inc.)
- Discotek Media
- Sentai Film Works (AMC Networks)
- Viz Media, LLC
- Atomic Flare
- Bandai Namco Filmworks Inc.
- The Walt Disney Company
- Toei Animation Inc.
- Lionsgate Entertainment Corp.
- Eleven Arts
- Good Smile Company, Inc.
- Bioworld Merchandising, Inc.
Segments Covered in the Report
By Type
- T.V.
- Movie
- Video
- Internet Distribution
- Merchandising
- Music
- Pachinko
- Live Entertainment
By Genre
- Action & Adventure
- Sci-Fi & Fantasy
- Romance & Drama
- Sports
- Others
| Type | 2025 | 2026 | 2027 | 2028 | 2029 | 2030 | 2031 | 2032 | 2033 | 2034 | 2035 |
|---|---|---|---|---|---|---|---|---|---|---|---|
| T.V. | 1.10 | 1.30 | 1.54 | 1.83 | 2.17 | 2.57 | 3.05 | 3.61 | 4.29 | 5.08 | 6.03 |
| Movie | 0.66 | 0.78 | 0.92 | 1.10 | 1.30 | 1.54 | 1.83 | 2.17 | 2.57 | 3.05 | 3.62 |
| Video | 0.44 | 0.52 | 0.62 | 0.73 | 0.87 | 1.03 | 1.22 | 1.45 | 1.71 | 2.03 | 2.41 |
| Internet Distribution | 0.44 | 0.52 | 0.62 | 0.73 | 0.87 | 1.03 | 1.22 | 1.45 | 1.71 | 2.03 | 2.41 |
| Merchandising | 0.22 | 0.26 | 0.31 | 0.37 | 0.43 | 0.51 | 0.61 | 0.72 | 0.86 | 1.02 | 1.21 |
| Music | 0.22 | 0.26 | 0.31 | 0.37 | 0.43 | 0.51 | 0.61 | 0.72 | 0.86 | 1.02 | 1.21 |
| Pachinko | 0.44 | 0.52 | 0.62 | 0.73 | 0.87 | 1.03 | 1.22 | 1.45 | 1.71 | 2.03 | 2.41 |
| Live Entertainment | 0.88 | 1.04 | 1.23 | 1.46 | 1.73 | 2.06 | 2.44 | 2.89 | 3.43 | 4.07 | 4.82 |
| Genre | 2025 | 2026 | 2027 | 2028 | 2029 | 2030 | 2031 | 2032 | 2033 | 2034 | 2035 |
|---|---|---|---|---|---|---|---|---|---|---|---|
| Action & Adventure | 1.53 | 1.82 | 2.16 | 2.56 | 3.03 | 3.60 | 4.27 | 5.06 | 6.00 | 7.12 | 8.44 |
| Sci-Fi & Fantasy | 0.88 | 1.04 | 1.23 | 1.46 | 1.73 | 2.06 | 2.44 | 2.89 | 3.43 | 4.07 | 4.82 |
| Romance & Drama | 1.10 | 1.30 | 1.54 | 1.83 | 2.17 | 2.57 | 3.05 | 3.61 | 4.29 | 5.08 | 6.03 |
| Sports | 0.44 | 0.52 | 0.62 | 0.73 | 0.87 | 1.03 | 1.22 | 1.45 | 1.71 | 2.03 | 2.41 |
| Others | 0.44 | 0.52 | 0.62 | 0.73 | 0.87 | 1.03 | 1.22 | 1.45 | 1.71 | 2.03 | 2.41 |
Research Methodology
Related Databooks
March 2026
March 2026
April 2026
April 2026

 sales@precedenceresearch.com
 +1 804-441-9344
 Download Databook
 Schedule a Meeting