North America Microwave Market Size is USD 7.43 Billion in 2026
North America Microwave Market (By Type: Countertop, Over-the-Range, and Built-In; By Technology: Convection and Traditional; By Price: Below $100, $100 to $300, $301 to $500, $501 to $1,000, $1,001 to $2,000, and Above $2,000; By Capacity: Small (Less than 1.5 cubic feet), Medium (1.5 to 2.5 cubic feet), and Large (More than 2.5 cubic feet); By Power: Low Power (Less than 800 watts), Medium Power (800 to 1,200 watts), and High Power (More than 1,200 watts); By Distribution Channel: Supermarkets & Hypermarkets, Specialty Stores, Home Improvement Stores, Online, and Others) Industry Size, Share, Growth, Trends 2026 to 2035.


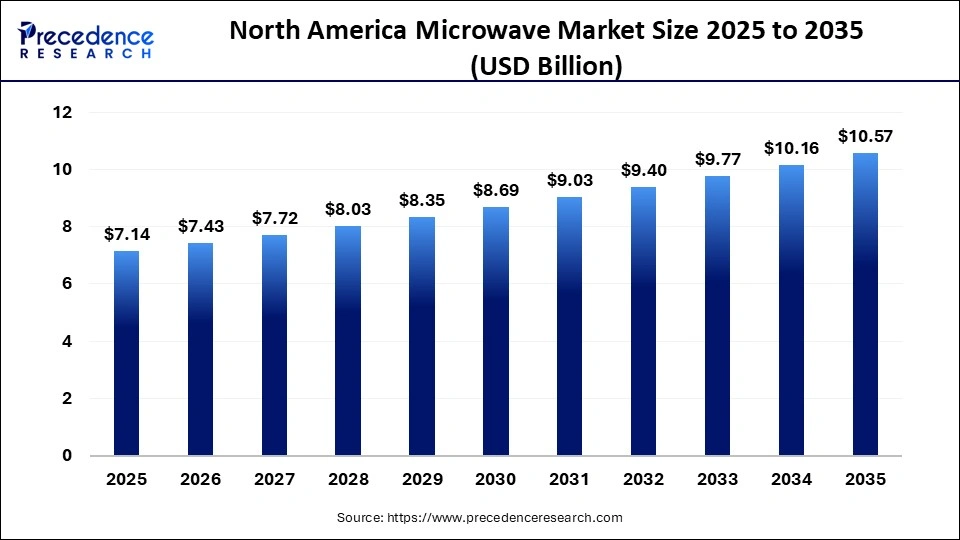
The North America microwave market is expected to grow from USD 7.14 billion in 2025, with a satisfying CAGR of 4%. This growing rise due to increasing demand for quick and convenient cooking solutions, rising urbanization, busy lifestyles, and higher consumption of ready-to-eat foods supported by advancements in smart and energy-efficient technologies.
North America Microwave Market Statical Scope
| Reports Attributes | Statistics |
| Market Size in 2025 | USD 7.14 Billion |
| Market Size in 2026 | USD 7.43 Billion |
| Market Size by 2035 | USD 10.57 Billion |
| CAGR 2026 to 2035 | 4% |
| Base Year | 2025 |
| Forecast Period | 2026 to 2035 |
The microwave oven advanced technologies, such as inverter systems, sensor-based cooking, convection and grill functions, and smart connectivity, enhance cooking efficiency, ensure even heating, and provide greater convenience to modern consumers.
The microwave oven is a continuous advancement due to ongoing technological innovation and increasing consumer demand for efficient cooking solutions. Modern features such as smart controls, precision cooking, and energy-efficient systems are enhancing product performance and usability. The growing adoption of advanced kitchen appliances, along with rising interest in convenient food preparation, is strengthening North America's microwave market growth.
Additionally, increasing investments, product development, and expanding applications in both residential and commercial sectors are further accelerating the expansion of the microwave oven market.
North America Microwave Market Share, By Type, 2025 (%)
| Segments | Shares (%) |
| Countertop | 58% |
| Over-the-Range | 27% |
| Built-In | 15% |
- Countertop- The segment dominated the market with a 58% share, driven by affordability, ease of installation, and versatile usage across both compact and spacious kitchens.
- Over-the-Range- The over-the-range segment held a 27% share of the overall market and was popular for its space-efficient design and dual functionality.
- Built-In- The built-in segment accounted for 15% of the total market share. Due to higher pricing and installation complexities.
North America Microwave Market Share, By Technology, 2025 (%)
| Segments | Shares (%) |
| Convection | 77% |
| Traditional | 23% |
- Convection-The segment dominated the market with a 77% share, due to its faster, more uniform cooking and versatile multi-function capabilities compared to traditional models.
- Traditional- The traditional segment held a 23% share of the overall market, driven by basic usage needs despite limited advanced cooking capabilities.
North America Microwave Market Share, By Price, 2025 (%)
| Segments | Shares (%) |
| Below $100 | 8% |
| $100 to $300 | 24% |
| $301 to $500 | 36% |
| $501 to $1,000 | 18% |
| $1,001 to $2,000 | 9% |
| Above $2,000 | 5% |
- Below $100- The segment accounted for 8% of the total market share. Due to limited features, lower durability, and basic performance, these entry-level microwave models are less attractive to modern consumers.
- $100 to $300- The segment accounted for 24% of the total market share. Although it appeals to budget-conscious consumers, this segment lacks the advanced features and performance offered by higher-priced microwave models.
- $301 to $500- The segment dominated the market with a 36% share. This prize segment is highly preferred as it offers an optimal mix of affordability and advanced features such as convection technology, delivering better performance and value to consumers.
- $501 to $1000- The segment accounted for 18% of the total market share. Higher prices restrict widespread adoption, even though these models offer superior features and improved build quality.
- $1,001 to $2,000- The segment accounted for 9% of the total market share. These projects primarily target premium kitchen buyers, appealing to a niche segment that values advanced features in high-end design.
- Above $ 2,000- The segment accounted for 5% of the total market share. Targeting luxury consumers and high-end kitchen setups, this segment appeals to a limited audience, which ultimately restricts its overall market share.
North America Microwave Market Share, By Capacity, 2025 (%)
| Segments | Shares (%) |
| Small (Less than 1.5 cubic feet) | 19% |
| Medium (1.5 to 2.5 cubic feet) | 68% |
| Large (More than 2.5 cubic feet) | 13% |
- Small (Less than 1.5 cubic feet)- The segment accounted for 19% of the total market share. As it is primarily designed for compact spaces and limited users, it is less suitable for broader consumer needs.
- Medium (1.5 to 2.5 cubic feet)- The segment dominated the market with a 68% share. It offers an ideal balance between capacity and size, making it well-suited for most households and everyday cooking requirements.
- Large (More than 2.5 cubic feet)- The segment accounted for 13% of the total market share. Larger models tend to be bulkier, more expensive, and often unnecessary for typical household needs.
North America Microwave Market Share, By Power, 2025 (%)
| Segments | Shares (%) |
| Low Power (Less than 800 watts) | 11% |
| Medium Power (800 to 1,200 watts) | 79% |
| High Power (More than 1,200 watts) | 10% |
- Low power (Less than 800 watts)- The segment accounted for 11% of the total market share. Lower wattage leads to slower cooking and reduced efficiency, making these microwave models less appealing to consumers seeking faster and more effective performance.
- Medium power (800 to 1,200 watts)- The segment dominated the market with a 79% share. Offering an ideal balance of energy efficiency and cooking performance, this segment is well-suited for a wide range of everyday household cooking needs.
- High power (More than 1,200 watts)- The segment accounted for 10% of the total market share. Higher-powered tend to be costlier and often exceed the requirements of typical household cooking, making them a less practical choice for everyday use.
North America Microwave Market Share, By Distribution Channel, 2025 (%)
| Segments | Shares (%) |
| Supermarkets & Hypermarkets | 18% |
| Specialty Stores | 16% |
| Home Improvement Stores | 39% |
| Online | 22% |
| Others | 5% |
- Supermarkets &Hypermarkets- The segment accounted for 18% of the total market share. Despite offering easy accessibility, it provides a more limited product range compared to specialized retail channels.
- Specialty Stores- The segment accounted for 16% of the total market share. Despite targeting premium buyers, its reach remains limited compared to broader retail formats.
- Home Improvement Stores-The segment dominated the market with a 39% share. Driven by a strong consumer preference for purchasing large appliances during home renovations or kitchen upgrades, where bundled deals and expert guides enhance the overall buying experience.
- Online- The segment accounted for 22% of the total market share. Due to steady expansion, driven by convenience, competitive pricing, and easy access to a wide variety of products.
- Others- The segment accounted for 5% of the total market share. It consists of smaller and less influential distribution channels with limited market reach.
Top Companies in the North America Mcrowave Market
- Whirlpool Corporation
- Samsung Electronics Co. Ltd.
- Robert Bosch GmbH
- LG Electronics Inc.
- Frigidaire (Electrolux Inc.)
- Kenmore (Transform Holdco LLC)
- GE Appliances (a Haier company)
- Panasonic Corporation
- Breville
- Sharp Corporation
Segments Covered in the Report
By Type
- Countertop
- Over-the-Range
- Built-In
By Technology
- Convection
- Traditional
By Price
- Below $100
- $100 to $ 300
- $301 to $500
- $501 to $1,000
- $1,001 to $2,000
- Above $2,000
By Capacity
- Small (Less than 1.5 cubic feet)
- Medium (1.5 to 2.5 cubic feet)
- Large (More than 2.5 cubic feet)
- Power Outlook (Revenue, USD Million, 2018 - 2030)
- Low Power (Less than 800 watts)
- Medium Power (800 to 1,200 watts)
- High Power (More than 1,200 watts)
By Distribution Channel
- Supermarkets &; Hypermarkets
- Specialty Stores
- Home Improvement Stores
- Online
- Others
| Type | 2025 | 2026 | 2027 | 2028 | 2029 | 2030 | 2031 | 2032 | 2033 | 2034 | 2035 |
|---|---|---|---|---|---|---|---|---|---|---|---|
| Countertop | 4.43 | 4.57 | 4.72 | 4.86 | 5.02 | 5.17 | 5.33 | 5.50 | 5.67 | 5.80 | 5.82 |
| Over-the-Range | 1.64 | 1.72 | 1.81 | 1.90 | 1.99 | 2.09 | 2.19 | 2.29 | 2.41 | 2.54 | 2.75 |
| Built-In | 1.07 | 1.14 | 1.21 | 1.28 | 1.35 | 1.43 | 1.52 | 1.61 | 1.70 | 1.83 | 2.01 |
| Technology | 2025 | 2026 | 2027 | 2028 | 2029 | 2030 | 2031 | 2032 | 2033 | 2034 | 2035 |
|---|---|---|---|---|---|---|---|---|---|---|---|
| Convection | 3.71 | 3.90 | 4.10 | 4.30 | 4.51 | 4.74 | 4.97 | 5.22 | 5.48 | 5.80 | 6.35 |
| Traditional | 3.43 | 3.53 | 3.63 | 3.74 | 3.85 | 3.95 | 4.07 | 4.18 | 4.30 | 4.37 | 4.23 |
Research Methodology
Related Databooks
April 2026
April 2026
April 2026
April 2026


 +1 804-441-9344
 Download Databook
 Schedule a Meeting