U.S. Composites Market Size is USD 18.24 Billion in 2026
U.S. Composites Market (By Product: Carbon Fiber, Glass Fiber, Others; By Manufacturing Process: Layup, Filament, Injection Molding, Pultrusion, Compression Molding, RTM, Others; By Application: Automotive & Transportation, Electrical & Electronics, Wind Energy, Construction & Infrastructure, Pipes & Tanks, Marine, Others) Industry Size, Share, Growth, Trends 2026 to 2035.


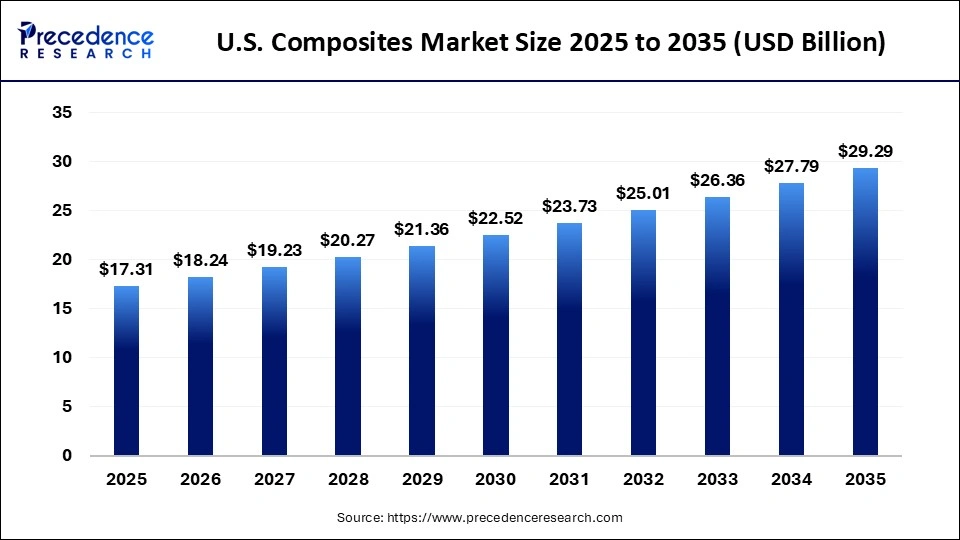
The U.S. composites market size was estimated at USD 17.31 billion in 2025 and is predicted to increase from USD 18.24 billion in 2026 to approximately USD 29.29 billion by 2035, expanding at A CAGR of 5.4% from 2026 to 2035. The market is mainly fueled by the need for lightweight and durable materials in the automotive sector, particularly for electric vehicle production, aerospace, and renewable energy industries.
U.S. Composites Market Statical Scope
| Reports Attributes | Statistics |
| Market Size in 2025 | USD 17.31 Billion |
| Market Size in 2026 | USD 18.24 Billion |
| Market Size by 2035 | USD 29.29 Billion |
| CAGR 2026 to 2035 | 5.4% |
| Base Year | 2025 |
| Forecast Period | 2026 to 2035 |
The U.S. composites market is important because it fosters innovation in lightweight, strong materials that are necessary for aerospace, automotive electric vehicles , and renewable energy (wind turbines). It plays a key role in cutting emissions, enhancing fuel efficiency, and aiding advanced manufacturing infrastructure. The U.S. serves as a center for aerospace, with a high need for composites in aircraft production and space exploration initiatives by major companies like Boeing and SpaceX.
To meet strict regulations and enhance electric vehicle (EV) range, car manufacturers are increasingly using composites for lighter vehicle structures. The rise in wind energy projects demands large, sturdy turbine blades, which significantly increases the need for glass and carbon fiber composites. Composites are vital for creating long-lasting, corrosion-resistant infrastructure like bridges and pipes, and specialized industrial parts. The industry is essential in creating sustainable materials, including bio-resins and recyclable composites, to help achieve environmental objectives.
U.S. Composites Market, By Product, 2025 (%)
| Segments | Shares (%) |
| Carbon Fiber | 35% |
| Glass Fiber | 65% |
- Carbon Fiber - The carbon fiber segment, with a share of 35%, is the fastest growing in the U.S. composites market due to its superior strength-to-weight ratio, essential for lightweighting in aerospace, automotive, and wind energy sectors.
- Glass Fiber - The glass fiber segment, with a share of 65%, is dominant in the market for its cost-effectiveness, high strength-to-weight ratio, and corrosion resistance, supporting key industries like automotive, wind energy, and construction in achieving lightweighting for emissions compliance.
U.S. Composites Market, By Manufacturing, 2025 (%)
| Segments | Shares (%) |
| Layup | 35% |
| Filament Winding | 29% |
| Injection Molding | 17% |
| Pultrusion | 19% |
- Layup - The lay-up segment, with a share of 35%, is dominant in the market, offering a flexible and cost-effective manufacturing method for large, complex components in fast-growing industries. It holds the largest revenue share in U.S. manufacturing, driven by the demand for customized solutions in marine, wind energy, and transportation.
- Filament - The filament winding segment, with a share of 29%, is essential in the market as the fastest-growing manufacturing method, driven by the need for strong, lightweight cylindrical structures in energy, aerospace, and defense, providing efficiency, automation, and consistent quality.
- Injection Molding - Injection molding, with a share of 17%, is the fastest-growing in the market, allowing for rapid, large-scale production of complex, lightweight parts at low costs. It is vital for mass-producing components in automotive, consumer electronics, and medical fields.
- Pultrusion - Pultrusion, with a share of 19%, is another important process in the market, offering an automated, continuous, and cost-effective method for producing high-performance, lightweight fiber-reinforced polymer (FRP) profiles, particularly for the construction, infrastructure, and wind energy sectors.
U.S. Composites Market, By Application, 2025 (%)
| Segments | Shares (%) |
| Automotive & Transportation | 30% |
| Electrical & Electronics | 19% |
| Wind Energy | 14% |
| Construction & Infrastructure | 37% |
- Automotive & Transportation - The automotive & transportation sector, with a share of 30%, holds the largest share in the market, driven by the need for lightweight materials to meet environmental regulations, enhance fuel efficiency, and improve performance in both traditional and electric vehicles.
- Electrical & Electronics - The electrical & electronics (E&E) sector, with a share of 19%, is the fastest growing in the market, driven by demand for lightweight, heat-resistant, and durable materials in electronics, electric vehicles (EVs), and infrastructure, particularly for insulating components in EVs and renewable energy systems.
- Wind Energy - The wind energy sector, with a share of 14%, is vital to the market, driving demand and innovation in materials like carbon fiber and advanced resins, while promoting sustainable, recyclable options.
- Construction & Infrastructure - The construction and infrastructure sector, with a share of 37%, is key to the market, fueling growth through the need for durable, corrosion-resistant, and lightweight alternatives to traditional materials like steel and concrete.
Top Companies in the U.S. Composites Market
- Owens Corning
- Woodsward Inc.
- Hexcel Corp.
- PPG Industries, Inc.
- Huntsman Corporation LLC
- DuPont
- Weyerhaeuser Company
- Momentive Performance Materials, Inc.
- Cytec Industries (Solvay. S.A.)
Segments Covered in the Report
By Product
- Carbon Fiber
- Glass Fiber
- Others
By Manufacturing Process
- Layup
- Filament
- Injection Molding
- Pultrusion
- Compression molding
- RTM
- Others
By Application
- Automotive & Transportation
- Electrical & Electronics
- Wind Energy
- Construction & Infrastructure
- Pipes & Tanks
- Marine
- Others
| Product | 2025 | 2026 | 2027 | 2028 | 2029 | 2030 | 2031 | 2032 | 2033 | 2034 | 2035 |
|---|---|---|---|---|---|---|---|---|---|---|---|
| Glass Fiber | 10.04 | 10.49 | 10.96 | 11.45 | 11.96 | 12.50 | 13.05 | 13.63 | 14.23 | 14.87 | 15.52 |
| Carbon Fiber | 4.67 | 5.02 | 5.38 | 5.78 | 6.19 | 6.64 | 7.12 | 7.63 | 8.17 | 8.75 | 9.37 |
| Others | 2.60 | 2.74 | 2.88 | 3.04 | 3.20 | 3.38 | 3.56 | 3.75 | 3.95 | 4.17 | 4.39 |
| Process | 2025 | 2026 | 2027 | 2028 | 2029 | 2030 | 2031 | 2032 | 2033 | 2034 | 2035 |
|---|---|---|---|---|---|---|---|---|---|---|---|
| Layup | 5.89 | 6.11 | 6.35 | 6.59 | 6.84 | 7.09 | 7.36 | 7.63 | 7.91 | 8.20 | 8.49 |
| Filament | 2.42 | 2.59 | 2.77 | 2.96 | 3.16 | 3.38 | 3.61 | 3.85 | 4.11 | 4.39 | 4.69 |
| Injection Molding | 2.77 | 2.95 | 3.15 | 3.36 | 3.59 | 3.83 | 4.08 | 4.35 | 4.64 | 4.95 | 5.27 |
| Pultrusion | 2.08 | 2.21 | 2.35 | 2.49 | 2.65 | 2.81 | 2.99 | 3.18 | 3.37 | 3.58 | 3.81 |
| Compression Molding | 1.73 | 1.84 | 1.96 | 2.09 | 2.22 | 2.36 | 2.52 | 2.68 | 2.85 | 3.03 | 3.22 |
| RTM | 1.38 | 1.48 | 1.58 | 1.68 | 1.79 | 1.91 | 2.04 | 2.18 | 2.32 | 2.47 | 2.64 |
| Others | 1.04 | 1.06 | 1.08 | 1.09 | 1.11 | 1.13 | 1.14 | 1.15 | 1.16 | 1.17 | 1.17 |

 sales@precedenceresearch.com
 +1 804-441-9344
 Download Databook
 Schedule a Meeting