U.S. Plywood Market Size is USD 24.92 Billion in 2026
U.S. Plywood Market (By End-use: Residential, Commercial; By Application: Structural, Non-Structural) Industry Size, Share, Growth, Trends 2026 to 2035.


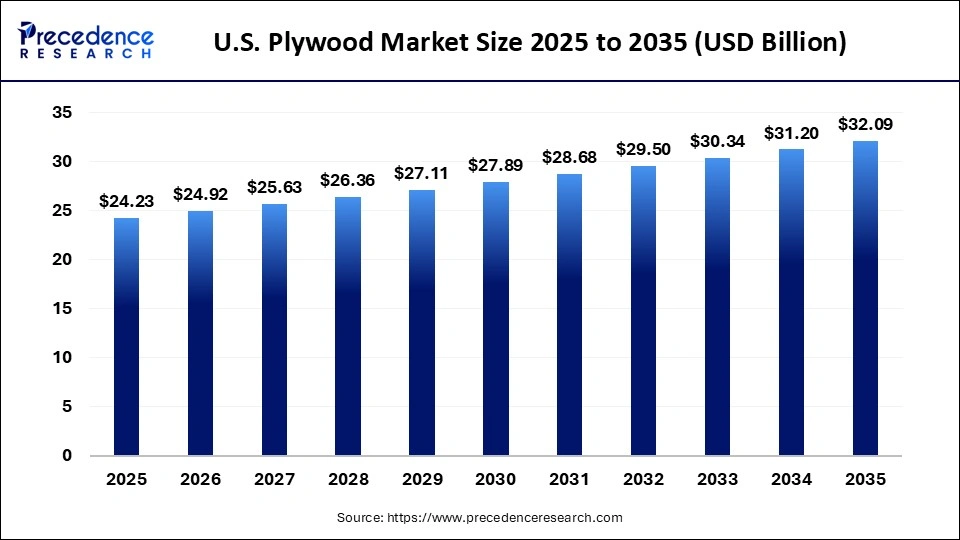
The U.S. plywood market size was estimated at USD 24.23 billion in 2025 and is predicted to increase from USD 24.92 billion in 2026 to approximately USD 32.09 billion by 2035, expanding at a CAGR of 2.85% from 2026 to 2035. Rising demand in residential construction, renovation, and furniture manufacturing is driving the market for plywood in the U.S.
U.S. Plywood Market Statical Scope
| Reports Attributes | Statistics |
| Market Size in 2025 | USD 24.23 Billion |
| Market Size in 2026 | USD 24.92 Billion |
| Market Size by 2035 | USD 32.09 Billion |
| CAGR 2026 to 2035 | 2.85% |
| Base Year | 2025 |
| Forecast Period | 2026 to 2035 |
Plywood is an engineered wood product composed of three or more thin sheets of wood, commonly referred to as plies. These plies are adhered together to produce a thicker, flat sheet, thereby forming plywood. The alternating grain direction of each layer in relation to its adjacent layers significantly enhances the strength of plywood compared to other wood-based sheet products, such as medium-density fiberboard (MDF).
The growth of the plywood market in the U.S. can be attributed to increasing disposable income and a rising demand for tourism, which has stimulated the construction of restaurants, hotels, and resorts. In addition, the rise in industrial construction activities, encompassing factories, warehouses, and plants, is driven by the escalating volume of international trade and an expanding demand for industrial goods.
Manufacturers are prioritizing enhancements in product quality, sustainability, and design. The growing utilization of plywood across various industries, coupled with heightened government investment in residential and commercial construction, continues to propel significant growth in the global plywood market.
U.S. Plywood Market Share, By End Use, 2025, (%)
| Segments | Shares (%) |
| Residential | 67% |
| Commercial | 33% |
Top Companies in the U.S. Plywood Market
- Georgia Pacific
- PotlatchDeltic Corporation
- Weyerhaeuser Company Ltd.
- Boise Cascade Company
- Roseburg Forest Products
- West Fraser
- Columbia Forest Products
- RoyOMartin
- Timber Products Company
- Coastal
- Hood Industry
- BlueLinx
- South Coast Lumber Co. & Affiliates
Segments Covered in the Report
By End-use
- Residential
- Commercial
By Application
- Structural
- Non-Structural
- Furniture
- Kitchen Cabinet
- Flooring
- Container Floor
- Others
| End-use | 2025 | 2026 | 2027 | 2028 | 2029 | 2030 | 2031 | 2032 | 2033 | 2034 | 2035 |
|---|---|---|---|---|---|---|---|---|---|---|---|
| Residential | 15.02 | 15.40 | 15.79 | 16.19 | 16.59 | 17.01 | 17.44 | 17.88 | 18.33 | 18.78 | 19.25 |
| Commercial | 9.21 | 9.52 | 9.84 | 10.17 | 10.52 | 10.88 | 11.24 | 11.62 | 12.01 | 12.42 | 12.84 |
| Application | 2025 | 2026 | 2027 | 2028 | 2029 | 2030 | 2031 | 2032 | 2033 | 2034 | 2035 |
|---|---|---|---|---|---|---|---|---|---|---|---|
| Structural | 16.48 | 16.90 | 17.33 | 17.77 | 18.22 | 18.69 | 19.16 | 19.65 | 20.15 | 20.65 | 21.18 |
| Non-Structural | 7.75 | 8.02 | 8.30 | 8.59 | 8.89 | 9.20 | 9.52 | 9.85 | 10.19 | 10.55 | 10.91 |
Research Methodology
Related Databooks
March 2026
March 2026
April 2026
April 2026

 sales@precedenceresearch.com
 +1 804-441-9344
 Download Databook
 Schedule a Meeting