U.S. Windows Market Size is USD 14.22 Billion in 2026
U.S. Windows Market (By Frame Material: Vinyl, Wood, Aluminum, and Other Frame Materials; By Type: Sliding Windows, Double/Single-hung Windows, Casement Windows, Awning Windows, Tilt & Turn Windows, and Other Windows; By End-use: New Construction and Refurbishment) Industry Size, Share, Growth, Trends 2026 to 2035.


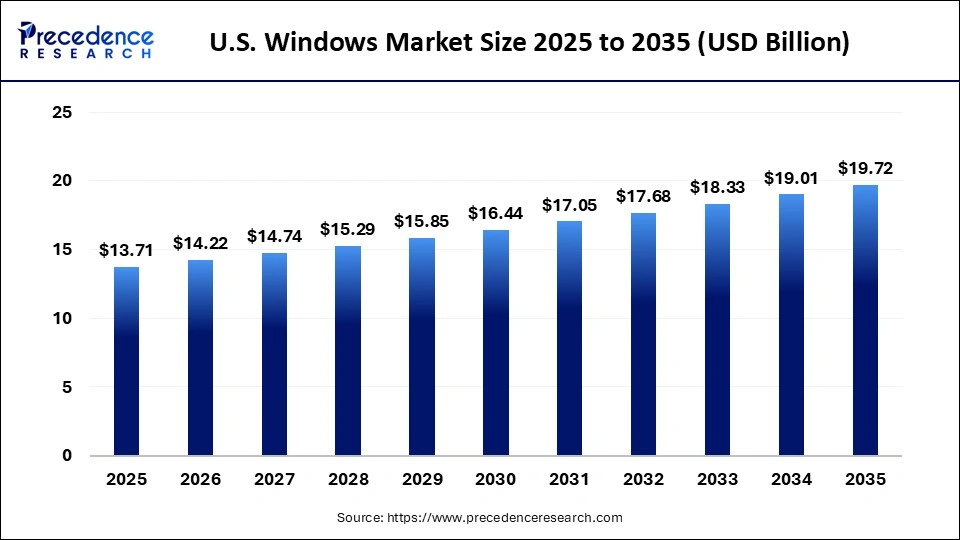
The U.S. windows market size was estimated at USD 13.71 billion in 2025 and is predicted to increase from USD 14.22 billion in 2026 to approximately USD 19.72 billion by 2035, expanding at A CAGR of 3.7% from 2026 to 2035. Due to rising residential and commercial construction, increased home renovations, and stronger demand for energy-efficient, durable, and aesthetically appealing windows that enhance comfort and reduce long-term energy costs.
U.S. Windows Market Statical Scope
| Reports Attributes | Statistics |
| Market Size in 2025 | USD 13.71 Billion |
| Market Size in 2026 | USD 14.22 Billion |
| Market Size by 2035 | USD 19.72 Billion |
| CAGR 2026 to 2035 | 3.7% |
| Base Year | 2025 |
| Forecast Period | 2026 to 2035 |
Technological innovations that go far beyond simple panes. Manufacturers are increasingly turning to smart and dynamic blessing technologies such as Thermo chromic and Photochromic Glass that can automatically adjust tint in response to sunlight or temperature, dramatically improving energy efficiency and indoor comfort. These intelligent systems can be integrated with building automation and riot controls, allowing equipment to manage lighting and heating previously via a smartphone or basic command on the production side.
Advances in precision manufacturing automation and novel materials are improving quality and lowering costs, while longer seal lengths and recycling programs enhance durability and sustainability. These technologies are transforming traditional windows into high-performance building components that reduce energy bills, enhance comfort, and support greener construction practices across both residential and commercial sectors.
U.S. Windows Market Share, By Frame, 2025 (%)
| Segments | Shares (%) |
| Vinyl | 38.20% |
| Wood | 22.40% |
| Aluminum | 27.60% |
| Other Frame Materials | 11.80% |
- Vinyl- Widespread use of these windows is driven by affordability and low maintenance advantages, with a 38.20% share. This reinforces that they are a strong presence, yet they remain behind premium alternatives due to competition in higher-end segments.
- Wood- High consumer demand for visually appealing designs, superior insulation, and premium finishes, holding a 22.4% market share, establishes it as the preferred frame material despite its relatively smaller presence in the overall market.
- Aluminum- The rise in preference for slick, durable, and lightweight window frames, capturing a 27.6% market share, is fueling swift adoption and growth across both residential and commercial projects.
- Other Frame Materials- Its narrow range of applications and user base accounting for just 11.80% market share limits broader adoption and constrains overall growth potential in the market.
U.S. Windows Market Share, By Type, 2025 (%)
| Segments | Shares (%) |
| Sliding Windows | 18.50% |
| Double/Single-hung Windows | 34.70% |
| Casement Windows | 21.00% |
| Awning Windows | 9.80% |
| Tilt & Turn Windows | 6.00% |
| Other Windows | 10.00% |
- Sliding Windows- Compact space-saving designs and user-friendly features holding an 18.50% market share drive steady demand, but still struggle to match the versatility and popularity of other Windows types.
- Double/Single-hung Windows- Open classic design, affordability, and extensive use in residential projects, capturing a 34.7% market share, make it the favorite and widely adopted window type.
- Casement Windows- Raising interest in better ventilation, energy-saving features, and contemporary designs, holding a 21% market share, is driving faster adoption of this window type across home and commercial spaces.
- Awining Windows- Its restricted design options and specialized applications represent a 9.80% market share, limiting wider adoption across varied residential and commercial settings.
- Tilt & Turn Windows- Despite its functional benefits, higher costs, and limited consumer awareness, with only a 6.4% market share, leading to its wider market growth.
- Other Windows- The niche appeal among a specialized user and custom design offering, capturing a 9.00% market share, contributes to a relatively modest presence in the overall market.
U.S. Windows Market Share, By End-use, 2025 (%)
| Segments | Shares (%) |
| New Construction | 55.00% |
| Refurbishment | 45% |
- New Construction- Rapid expansion in residential and commercial construction, fueled by urbanization and infrastructure development, accounts for a 55% market share, cementing its position as the leading segment in the market.
- Refurbishment- Rising emphasis on renovation, energy-efficient upgrades, and replacing outdated infrastructures, capturing a 45% market share, is driving faster growth in the segment.
Top Companies in the U.S. Windows Market
- Jeld-Wen Inc.
- PGT Innovation, Inc.
- Cornerstone Building Brands
- Andersen Corporation
- The Pella Corporation
- Starline Windows
- MI Windows and Doors
- Marvin
- VELUX Group
- Harvey Building Products
- Apogee Enterprises, Inc.
- Associated Materials Incorporated
- Profine International Group
Segments Covered in the Report
By Frame Material Vinyl
- Wood
- Aluminum
- Other Frame Materials
By Type
- Sliding Windows
- Double/Single-hung Windows
- Casement Windows
- Awning Windows
- Tilt & Turn Windows
- Other Windows
By End-use
- New Construction
- Refurbishment
| Frame Material | 2025 | 2026 | 2027 | 2028 | 2029 | 2030 | 2031 | 2032 | 2033 | 2034 | 2035 |
|---|---|---|---|---|---|---|---|---|---|---|---|
| Vinyl | 6.44 | 6.71 | 6.99 | 7.28 | 7.58 | 7.89 | 8.22 | 8.56 | 8.91 | 9.28 | 9.66 |
| Wood | 3.84 | 3.95 | 4.07 | 4.19 | 4.31 | 4.44 | 4.57 | 4.70 | 4.84 | 4.98 | 5.13 |
| Aluminum | 2.88 | 3.00 | 3.12 | 3.26 | 3.39 | 3.53 | 3.68 | 3.84 | 4.00 | 4.16 | 4.34 |
| Other Frame Materials | 0.55 | 0.55 | 0.56 | 0.57 | 0.57 | 0.58 | 0.58 | 0.58 | 0.59 | 0.59 | 0.59 |
| End-use | 2025 | 2026 | 2027 | 2028 | 2029 | 2030 | 2031 | 2032 | 2033 | 2034 | 2035 |
|---|---|---|---|---|---|---|---|---|---|---|---|
| New Construction | 6.03 | 6.23 | 6.43 | 6.64 | 6.85 | 7.07 | 7.30 | 7.53 | 7.77 | 8.02 | 7.89 |
| Refurbishment | 7.68 | 7.99 | 8.31 | 8.65 | 9.00 | 9.37 | 9.75 | 10.15 | 10.56 | 10.99 | 11.83 |
Research Methodology
Related Databooks
March 2026
March 2026
April 2026
April 2026

 sales@precedenceresearch.com
 +1 804-441-9344
 Download Databook
 Schedule a Meeting