Military Electro-Optical and Infrared Systems Market Trends, Size, Share, Key Companies, Production Capacity, and Forecast 2026-2035
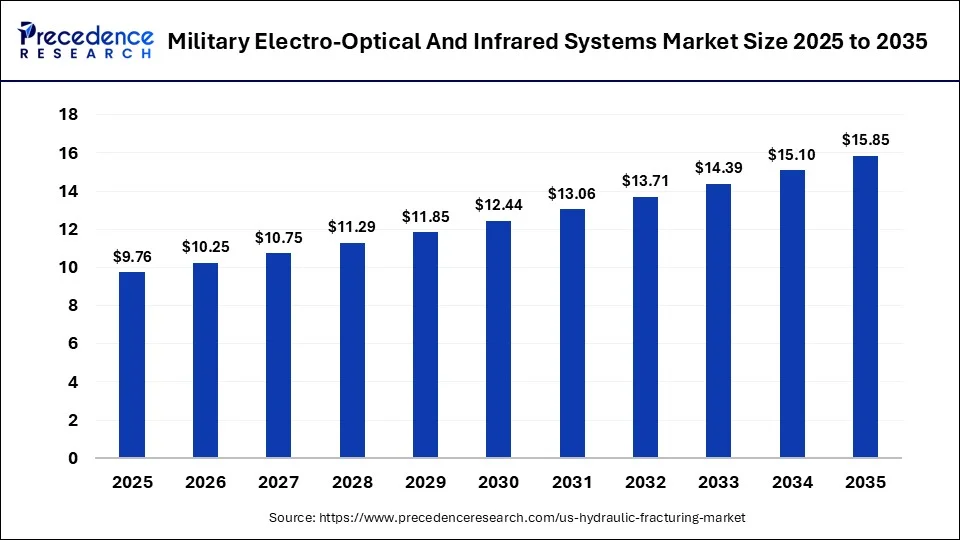
Laxmi Narayan an Aerospace and Defence Industry Expert, identifies strong market momentum in the military EO/IR systems and infrared systems market, which reached USD 10.25 billion in 2026 and is projected to attain USD 15.85 billion by 2035 at a CAGR of 4.97%. Major market companies, including Teledyne Technologies, L3Harris Technologies and Leonardo DRS, compete across critical segments such as by platform, application, imaging technology, sensor technology, components, wavelength, end user and region.
Source: https://www.precedenceresearch.com/military-electro-optical-and-infrared-systems-market
 Get a Sample
 Table Of Content


Military Electro-Optical And Infrared Systems Market Size, Demand and Trends Analysis
The military electro-optical and infrared (EO/IR) systems market is forecasted to expand from USD 10.25 billion in 2026 to USD 15.85 billion by 2035, growing at a CAGR of 4.97% from 2026 to 2035. Demand spans airborne, land-based and naval platforms, with applications concentrated in surveillance and reconnaissance, target acquisition, weapon sighting and fire control, navigation, and counter-UAS missions.
- By platform, the airborne segment led the market with a share of 34.20% in 2026.
- By application, the surveillance and reconnaissance segment led the market with a 30.95% share in 2026.
- By imaging technology, the infrared systems segment captured a major revenue share of 40.2% in 2026.
- By cooling technology, the uncooled segment captured the largest market share of 57.8% in 2026.
- By sensor technology, the filtration kits and reagents segment led the market with a share of 56.9% in 2026.
- Teledyne Technologies ranks number one at 100, L3Harris Technologies is at 96, and Leonardo DRS is at 91, where the majority of the top-ranked are EO/IR specialists and not the revenue leaders.
- Interestingly, Thales overall company size places sixth on the competitive index despite creating the highest total revenue of USD 22.0 billion, showing that the competitive size measure is not the same as company size, in this case applied to the EO/IR market.
- Both L3Harris and Elbit Systems had 9 categories of applications, though there was a relatively small difference between the companies, meaning there may be a strong inverse relationship between the number of applications listed and the number of unique applications it offers.
- North America (18) and Europe (22) have a similar number of top competitors, with the latter having an impressive revenue performance driven by the three
- European companies (Thales, Leonardo and HENSOLDT).
- Thermal imaging held a narrow ‘innovation lead' over AI processing on the 100 to 93 score show, suggesting that AI-powered sensing is soaring towards the status of core sensor innovations.
Market Overview
The military electro-optical and infrared systems market is estimated at USD 10.25 billion in 2026 and is expected to expand at a CAGR of 4.97% to reach USD 10.99 billion by 2035. Demand includes modernization of military platforms and an increasing requirement for reliable sensing, both day and night and in harsh operating environments. Their applications are rapidly expanding to airborne, land-based, naval, and unmanned platforms in the fields of surveillance and reconnaissance, target acquisition, weapon sighting/fire control, navigation, and counter-UAS.
The market is transitioning in the direction of multispectral imaging and integrated multispectral sensor systems that consist of electro-optical cameras, an integrated infrared (IR) detector, laser range finders, and target tracking components. This pace is of critical significance as the military's focus is on significantly decreasing the time between detection and identification of a threat, further decreasing the time between detection and response. Moreover, smaller size and weight and greater resolution of these systems are driving other market participants such as those having a good infrared detector, optical, image processing, and sensor integration capability.
Which Companies Have the Strongest Competitive Presence in Military Electro-Optical and Infrared Systems?
| Company | Competitive Index |
| Teledyne Technologies | 100 |
| L3Harris Technologies | 96 |
| Leonardo DRS | 91 |
| Elbit Systems | 89 |
| HENSOLDT | 85 |
| Thales | 82 |
| Leonardo | 79 |
| Saab | 73 |
Teledyne Technologies is setting a benchmark for the competitive index with a score of 100, marking its high ratings for all of the factors that are important to winning in this market. L3Harris Technologies (96) and Leonardo DRS (91) are close in the market. Those who haven't won are Elbit Systems (89), HENSOLDT (85), Thales (82), Leonardo (79), and Saab (73). Furthermore, this index is not based on any single measure of competitive strength but instead is a broad-based measurement that takes into account technology depth, program wins, platform coverage, and overall positioning in the market. Teledyne's competitive strengths in the market and vigorous go/no-go philosophy are examples of its strong leadership, proving that expertise and execution, not size, take precedence when it comes to competitive advantage.
- Key Insight: The top 10 entries for the Teledyne Technologies competitive index (100) feature companies that are predominantly specialists in EO/IR, with the overall index not necessarily ranking in order of company size.
Source: Precedence Research Database
How Large Are Leading Military EO/IR Companies by Annual Revenue?
| Company | Revenue (USD Million) |
| Thales | 22,000 |
| L3Harris Technologies | 21,400 |
| Leonardo | 19,000 |
| Elbit Systems | 6,800 |
| Teledyne Technologies | 5,950 |
| Saab | 5,700 |
| Leonardo DRS | 3,200 |
| HENSOLDT | 2,670 |
Thales sees the highest total company revenue at USD 22.0 billion, just ahead of L3Harris Technologies (USD 21.4 billion) and Leonardo (USD 19.0 billion). Elbit Systems, which has been holding at USD 6.8 billion; Teledyne Technologies at USD 5.95 billion; Saab at USD 5.7 billion; Leonardo DRS at USD 3.2 billion; and HENSOLDT followed at USD 2.67 billion.
These figures can include military revenues for EO/IR systems. That's what has enabled the three leading companies here to have higher total revenue on the final, diversified business measure but be outranked by Teledyne in the market. A large aerospace and defense conglomerate is able to hold a larger balance sheet than even one of the more niche sensor businesses and still have a relatively small EO/IR business within it.
- Key Insight: Thales leads total revenue at USD 22.0 billion despite ranking sixth on the competitive index, underscoring that total company revenue and EO/IR-specific competitive strength measure two different things entirely.
Source: Company Annual Reports / Precedence Research Database
How Many Major EO/IR Technology Applications Are Supported by Leading Defense Companies?
| Company | Application Categories |
| L3Harris Technologies | 9 |
| Elbit Systems | 9 |
| Teledyne Technologies | 8 |
| Leonardo DRS | 8 |
| Thales | 8 |
| Leonardo | 8 |
| HENSOLDT | 7 |
| Saab | 7 |
L3Harris Technologies and Elbit Systems are tied for the largest application coverage, with 9 categories each, the most in this comparison. On the other hand, Teledyne Technologies, Leonardo DRS, Thales, and Leonardo each have 8 categories of applications with which they support the public. HENSOLDT and Saab support the public across 7 applications each. The tight clustering across most of this list, with six of the eight companies sitting within a single category of each other, further suggests that broad application coverage has become close to a baseline requirement for competing at the top of this market rather than a differentiator any one company can claim uniquely.
- Key Insight: L3Harris and Elbit Systems have the widest applications of their own, with 9 categories each, but the other categories are so close together that broad applications have become baseline, rather than the key difference.
Source: Company Product Portfolios / Precedence Research Database
Which Military Platforms Generate the Highest EO/IR System Demand?
| Platform | Demand Index |
| Airborne | 100 |
| Unmanned Systems | 94 |
| Land Vehicles | 87 |
| Naval Platforms | 76 |
| Soldier Systems | 71 |
| Space Systems | 65 |
At the higher end of this spectrum, with the top set at 100, are three applications extremely similar in how they are achieved. They are all closely related to the central mission set that EO/IR systems were designed to be a part of, such as intelligence, surveillance, target acquisition, and reconnaissance.
The highest number of EO/IR systems are developed for airborne applications (100), followed by unmanned systems (94) and land vehicles (87). The demand for EO/IR systems is also high among naval and space operations; however, advanced technologies are being created to develop EO/IR systems. This has led to 76 naval systems 71 soldier systems, and 65 space systems of demand index.
- Key Insight: Ten points or less of the application index for intelligence, surveillance, target acquisition, and reconnaissance (ISTAR) are within 10 points of each other near the top of the application index, indicating the important role such sensor technology plays in all three core missions.
Source: Precedence Research Database
How Is Military EO/IR Technology Demand Distributed by Core Application?
| Application | Demand Index |
| Intelligence Surveillance | 100 |
| Target Acquisition | 94 |
| Reconnaissance | 90 |
| Night Vision | 85 |
| Border Surveillance | 77 |
| Fire Control | 72 |
Intelligence surveillance sets the top of this index at 100, followed by target acquisition at 94 and reconnaissance at 90, three closely clustered applications that together define the core mission set most EO/IR systems are actually built to serve. The night vision is 85, border surveillance is 77, and fire control is 72. The differences among the top three applications (only 10 points between intelligence, surveillance, target acquisition, and reconnaissance) show that these three applications rely largely on the same types of sensors and processing technology but do not require fundamentally new system designs.
Key Insight: The application index scores for intelligence, surveillance, target acquisition, and reconnaissance (ISTAR) are within 10 points of each other near the top of the index, indicating the important role such sensor technology plays in all three core missions.
Source: Precedence Research Database
Which Regions Have the Highest Military EO/IR Company Concentration?
| Region | Major Companies |
| North America | 18 |
| Europe | 22 |
| Asia Pacific | 16 |
| Middle East | 9 |
| Latin America | 5 |
| Africa | 3 |
The major companies are concentrated in Europe with 22, followed by North America with 18 and Asia Pacific with 16. The Middle East trails at 9, Latin America trails at 5, while Africa trails at 3. Europe's industrial health follows that of the top revenue providers, as outlined previously. These three companies are among the largest manufacturers within the region, indicating that the manufacturing sector has grown with, not apart from, the biggest defense companies.
Key Insight: The distribution of companies by concentration is similar in Europe, with 22, ahead of North America's 18, where Thales, Leonardo, and HENSOLDT performed well in terms of revenue.
Source: Precedence Research Database
How Is Military EO/IR Technology Innovation Distributed Across Key Areas?
| Technology Area | Innovation Index |
| Thermal Imaging | 100 |
| Artificial Intelligence | 93 |
| Multispectral Imaging | 88 |
| Edge Processing | 84 |
| Hyperspectral Imaging | 79 |
| Autonomous Sensors | 75 |
Thermal imaging sets the bar at 100 and best represents the area of technology that is most advanced and heavily invested in this market. These are followed by autonomous sensors (75), hyperspectral imaging (79), edge processing (84), multispectral imaging (88), and artificial intelligence (93), respectively. Artificial intelligence sits just seven points behind thermal imaging, despite being a far newer technology area. That signals how aggressively defense companies have directed innovation spend toward AI-enabled image processing and automated target recognition, rather than treating it as a secondary investment behind core sensor development.
- Key Insight: Thermal imaging outperforms AI processing on only seven points of innovation, 100 to 93, suggesting that AI's sensing abilities are now a close second to core sensor innovation.
Source: Precedence Research Database
How Many Major Military EO/IR Product Categories Are Offered by Leading Companies?
| Company | Product Categories |
| Teledyne Technologies | 14 |
| L3Harris Technologies | 13 |
| Elbit Systems | 12 |
| Leonardo DRS | 11 |
| HENSOLDT | 10 |
| Thales | 10 |
| Leonardo | 9 |
| Saab | 8 |
In terms of diversified product range, Teledyne Technologies is ahead of L3Harris Technologies and Elbit Systems with an offering of 14 product categories versus 13 and 12, respectively. Leonardo DRS is trailing both HENSOLDT at 10 and Thales at 10, Leonardo at 9, and Saab at 8. Additionally, this ranking is very close to the competitive index, as Teledyne, L3Harris, and Elbit are the three companies that are found in the top three spots on both measurements. Further indicating product breadth is one of the more consistent and distinct drivers of overall competitive positions on this index across the market.
- Key insight: Product breadth drives competitive position, and the subsequent index is virtually the same as the competitive index for Teledyne, with Teledyne being first in 14 categories.
Source: Company Portfolios / Precedence Research Database
Buyer Intelligence
Which Defense Organizations Are the Primary Buyers of Military EO/IR Systems?
| Buyer Category | Buying Index |
| National Defense Ministries | 100 |
| Air Forces | 94 |
| Defense Prime Contractors | 91 |
| Land Forces | 89 |
| Naval Forces | 83 |
| Intelligence Agencies | 76 |
The biggest and most coordinated procurement authority in the market is that of national defense ministries, which anchor the buying index at 100. Air forces come next at 94, defense prime contractors come in at 91, land forces at 89, naval forces at 83, and intelligence agencies at 76. The third ranking of defense prime contractors, behind only the defense services industry and aviation, puts a spotlight on the increasing share of EO/IR procurement. They are majoring in large defense integrated weapons interest contracts and not only in direct procurement for the defense services.
Key Insight: Defense prime contractors rank third on the buying index at 91, ahead of individual land and naval forces, showing how much EO/IR procurement now routes through integrated weapons-system contracts.
Source: Precedence Research Database
What Factors Have the Greatest Influence on Military EO/IR System Procurement?
| Procurement Factor | Importance Index |
| Detection Range | 100 |
| Image Quality | 97 |
| Reliability | 95 |
| Target Identification | 93 |
| System Integration | 90 |
| Lifecycle Cost | 85 |
| Weight | 81 |
| Power Consumption | 78 |
Classified different procurement factors into an importance index based on their influence on the military EO/IR system. The detection range, procurement importance, and image quality share points at 100, closely followed by reliability at 95. Target identification is at 93, system integration at 90, lifecycle cost at 85, weight at 81, and power consumption at 78. The clustering of the top three factors within five points of one another is an indication that in most procurement decisions, raw sensor performance is still an important factor, ahead of lifecycle cost, weight, and power consumption.
Key Insight: Detection range, image quality, and reliability are grouped within 5 points on top of the procurement index, further validating the fact that in most purchase procedures, the performance of the raw sensor is a key and primary consideration that far outweighs cost and logistics.
Source: Precedence Research Database
Which Buyer Programs Are Creating the Strongest Future Demand for Military EO/IR Systems?
| Program Area | Future Demand Index |
| Unmanned Aerial Systems | 100 |
| ISR Modernization | 96 |
| Autonomous Systems | 91 |
| Border Security | 86 |
| Land Vehicle Modernization | 83 |
| Naval Surveillance | 78 |
| Soldier Modernization | 74 |
The fastest-growing demand areas are unmanned aerial systems (100) and ISR modernization (96), with autonomous systems (91) coming in third, topping that are border security at 86, land vehicle modernization at 83, naval surveillance at 78, and soldier modernization at 74. The ranking of unmanned aerial systems and autonomous systems in the top 3 of programs-below-demand reflects this same relationship in the same kind of platform-demand data discussed above. These uncrewed systems were also top three in the battle for the incremental market lead over airborne platforms. Further validating the notion that uncrewed platforms will be the main engines of EO/IR growth over the next ten years.
- Key Insight: Unmanned aerial systems and autonomous systems both figure prominently in the top three future-demand programs offering additional support to the platform-demand data, where uncrewed systems are clearly the biggest opportunity for incremental growth ahead of EO/IR.
Source: Precedence Research Database
Segmentation Analysis
By Platform
Airborne platforms represent the highest market share in 2026 at 55.65%, which will drop to 54.10% by 2035 at a 4.55% CAGR, fueled by UAV growth and upgrades, combined with continued demand for airborne ISR missions. Naval platforms have a moderate share of the market, at 15.75%, which is easing to 15.15%, with a prolonged 4.55% CAGR due to naval surveillance and shipboard threat detection needs arising on these platforms.
The demand in the Land-based segment has surged twice, from 28.60% to 30.75%, the fastest of the three segments, with a CAGR of 5.95%, with the vehicle modernization programs, soldier systems, and the proliferation of ground surveillance requirements. The monthly demand for the Land-based segment has increased by 5.95%, the highest of the three. Compared to the demand of other gigantic sectors such as Airborne and Naval that grew in the same period by 4.3% and 4.45%, respectively.
- Key Insight: Land-based platforms grow at a CAGR of 5.95% to reach 30.75% market share, while the airborne platforms and naval platforms grow at the same CAGR of 4.55%.
Source: Precedence Research Database
By Application
The largest application of surveillance and reconnaissance is at 30.95% in 2026, followed by target acquisition and designation at 22.10% and weapon sighting and fire control at 17.05%. Navigation & guidance is the largest segment at 13.35% and counter-UAS the smallest at 9.10%, while the other applications hold 7.45% of the market share. Despite being one of the younger application areas to emerge within this market, counter-UAS has achieved an almost 9% market share in this market. Stating that UAS needs have quickly morphed from something just starting to appear to a separate budget item for many defense buyers.
- Key Insight: Surveillance & reconnaissance currently accounts for 30.95% of the overall applications market, and counter-UAS already has its own notable slice of the pie, meaning drone defense is a fast-growing within-market, and not just an afterthought.
Source: Precedence Research Database
By Imaging Technology
Imaging technology's market share in 2026 is forecast by the capital market to be 40.20%, led by infrared (IR) systems, further followed by electro-optical (EO) systems with 36.65% and hyperspectral and multispectral systems with 23.15%. The infrared/EO system difference in roadpoints is relatively small, less than 4 percentage points. Due to the capability of most modern EO/IR systems to have both capabilities in the same sensor payload rather than separate deployments of some or all of the capabilities.
- Key Insight: Infrared systems hold the lion's share of the imaging technology market at 40.20%, trailing only electro-optical systems, which hold 36.65%, as shown, indicating that the two are often being combined in sensor payloads.
Source: Precedence Research Database
By Cooling Technology
Outside of the cooling technology split, uncooled systems have the greater share in 2026, accounting for 57.80% compared with cooled systems at 42.20%; that is the compromise that runs through this market between the price of the sensor and performance. Uncooled sensors are cheaper and cost less to maintain, while cooled sensors are the most significant factor in deciding who's doing a good job of getting the most performance for the money on all the other factors in the procurement process, which covered the price of the instrument.
- Key Insight: Uncooled systems have 57.80% market share, compared with 42.20% for cooled systems, an imbalance that is a compromise between cost and simplicity and the longer range achieved by procurement data, which ranks as the market's first buying criterion.
Source: Precedence Research Database
By Sensor Technology
Staring sensors accounted for a 56.90% share in 2026, while scanning sensors took a 43.10% share. Staring array technology has increasingly replaced mechanically scanned designs in newer system generations. Because of its lack of moving parts, vast field-of-view capabilities, and increased reliability when operating in the field. The benefits have aligned closely with reliability and image quality, two key factors that frequently rank high on the procurement importance index.
Key Insight: Staring sensors have an edge over scanning sensors with a 56.90% share because of their reliability and the strong preference for image quality. They are found to be some of the most important factors when purchasing these types of sensors.
Source: Precedence Research Database
By Component
In the core value capture layer of any EO/IR system, the largest component share is assigned to sensors and detectors, with a share of 31.25% in 2026. Optics and lenses make up 18.05% of other parts, processors 15.80%, stabilization systems 11.95%, control systems 10.15%, displays 7.10%, and other components 5.70%. Sensors and detectors alone command close to a third of the total component value; the sensing layer, not the surrounding hardware, remains where the majority of a system's engineering value and cost genuinely concentrate.
- Key Insight: Sensors and detectors measure a third of the components' share (29.57%) and account for nearly a third of total component value, the same area where most of the engineering value is home.
Source: Precedence Research Database
By Wavelength
Long-wave infrared has the highest percentage at 27.35% in 2026, followed by mid-wave infrared at 25.10% and visible-spectrum imaging at 18.95%. 13.85% of the short-wave infrared, 9.05% of the near-wave infrared, and other wavelengths make up the remaining 5.70%. Long-wave and mid-wave contribute the majority of the wavelength share, collectively accounting for more than half of the total wavelength share. Reflecting military EO/IR use trends in long-range applications for target acquisition and thermal detection.
- Key Insight: Both long-wave (27.35%) and mid-wave infrared (25.10%) have more than 50% of the share of wavelengths and play a critical role for thermal detection and long-range targeting.
Source: Precedence Research Database
By End User
In terms of share, arm and land forces are the biggest end-user segment, accounting for 40.35% share, closely followed by the air force at 29.95%, and then followed by the Navy and Coast Guard at 20.45%. Everything else, which represents the remaining 9.25%, is special operations forces. This result is not driven by a predominance of purchases of EO/IR equipment from a single platform category, such as airborne platforms, since the umbrella category of Army and land forces bought the most, at 86.0%, with its share split among platforms, soldier systems, and surveillance posts.
Key Insight: Army and land forces hold the largest end-user share at 40.35%, ahead of the air force at 29.95%, reflecting how EO/IR equipment spreads across vehicles, soldier systems, and ground posts rather than concentrating in one platform type.
Source: Precedence Research Database
By Region
North America also performs best within the region at a 35.10% share in 2026, followed by Europe at 25.35% and Asia Pacific at 24.70%. Middle East and Africa accounts for 9.05%, and Latin America accounts for 5.80% of the market, respectively. This small gap of 0.65 per cent between the European and Asia Pacific concentrations of companies. Their dominant manufacturing demand highlights Asia Pacific's manufacturing demand progression, which is growing at a higher rate than its share of companies would imply.
- Key Insight: The size of the gap between Europe and Asia Pacific in company concentration is extremely small, despite the huge size of the European market, implying that demand from Asia Pacific is exceeding its manufacturing capacity.
Source: Precedence Research Database
Expert Insights
Transforming military sensing from conventional imaging toward a networked, multispectral, and increasingly autonomous battlefield awareness architecture. The research focused mainly on developing a satellite-airborne imaging radar system for broadband, full-band. The main emphasis of the research was directed towards the development of a satellite-airborne imaging radar system for broadband, full-band. The fusion of high-performing infrared detectors and processing electronics on-board is a space where I feel attractive opportunities are developing.
In modern forces, particularly, sensors that can sense, identify, track, and assist in the engagement of targets in day and night, adverse weather, and contested environments are becoming a major requirement. This trend is making more demands of EO/IR systems that integrate thermal imaging, target designation, and multispectral sensing in smaller platforms. I believe the increasing complexity of the modern battlefield, proliferation of UAS, and investment in intelligence, surveillance, and reconnaissance. These will be big factors in competitiveness in the upcoming decade.
Our Experts
Laxmi Narayan led market research, carried out the methodology, and analyzed technology segmentation, application trends, regional trends, competition, procurement programs, and market forecasts, providing the basis for analysis in the report.
Aman took charge of gathering and cleaning information on defense procurements, company financials, contract announcements, technology advancements, and other data, gathered independently, thus enriching the evidence on market estimates.
Ensured accuracy, consistency, and clarity of information in the complete research document; carried out quality checks, validated findings, refined content, corrected information or evidence that was inconsistent, and finalized the research document.
Questions This Report Deliberately Leaves Open
- How large will the military electro-optical and infrared systems market become by 2030 and 2035?
- Why does Land-Based platform demand grow fastest (5.95% CAGR) even though Airborne remains the dominant platform by share?
- How should the Competitive Index (Teledyne Technologies at 100, L3Harris at 96) be reconciled against company revenue, given Thales ($22,000M) and L3Harris ($21,400M) report far higher total revenue than Teledyne ($5,950M)?
- What does the gap between total company revenue and EO/IR-specific competitive positioning reveal about how much of each company's business is actually defense-sensor-focused versus diversified?
- Which imaging technology - Infrared Systems (largest at 40.20% share) or Hyperspectral & Multispectral Systems (smallest but likely highest-growth given innovation-index rankings) - represents the stronger long-term investment priority?
- How significant is the shift toward Uncooled sensors (57.80% share) relative to Cooled systems, given cooled systems' historical performance advantages in long-range detection?
- What does Unmanned Systems' position as the second-highest platform demand index (94, just behind Airborne at 100) signal about where future EO/IR integration will concentrate?
- How should companies interpret the gap between Thermal Imaging's innovation-index leadership (100) and Artificial Intelligence's close second position (93) when allocating R&D investment?
- Which region - Europe (22 major companies, the highest concentration) or Asia-Pacific (24.70% share, likely the fastest-growing) - offers the stronger competitive entry opportunity for new suppliers?
- How should Detection Range and Image Quality's dominance as procurement factors (100 and 97 respectively) shape product-development prioritization relative to Lifecycle Cost (85) and Power Consumption (78)?
- What does Unmanned Aerial Systems' position as the top future-demand program (100) mean for companies currently under-indexed on unmanned-platform integration?
- How concentrated is buyer power among National Defense Ministries (buying index 100) relative to more fragmented demand from individual service branches?
- Which company is best positioned given the combination of high competitive index, broad product-category count, and application-category breadth - Teledyne Technologies or L3Harris Technologies?
- How should smaller-scale disclosed competitors (HENSOLDT, Saab) differentiate against larger diversified defense primes (Thales, Leonardo, L3Harris) given their narrower revenue base?
- What is the realistic timeline for Counter-UAS applications to grow beyond their current 9.10% share given rising demand for autonomous and unmanned-system defense?
References
Precedence Research Database
Military Electro-Optical and Infrared Systems Market - Company Landscape, Competitive Analysis, and Segmentation Data
- Data used: Market size, CAGR, all company competitive-index/revenue/portfolio tables, buyer-intelligence tables, and all segment share tables presented throughout this report.
Military Electro-Optical and Infrared Systems Market Segment
By Platform
- Airborne
- Land-Based
- Naval
By Application
- Surveillance & Reconnaissance
- Target Acquisition & Designation
- Weapon Sighting & Fire Control
- Navigation & Guidance
- Counter-UAS
- Other Applications
By Imaging Technology
- Infrared Systems
- Electro-Optical Systems
- Hyperspectral & Multispectral Systems
- By Cooling Technology
- Uncooled
- Cooled
By Sensor Technology
- Staring Sensors
- Scanning Sensors
By Component
- Sensors & Detectors
- Optics & Lenses
- Processors
- Stabilization Systems
- Control Systems
- Displays
- Other Components
By Wavelength
- Long-Wave Infrared
- Mid-Wave Infrared
- Visible
- Short-Wave Infrared
- Near-Wave Infrared
- Other Wavelengths
By End User
- Army/Land Forces
- Air Force
- Navy/Coast Guard
- Special Operations Forces
By Region
- North America
- Europe
- Asia Pacific
- Middle East & Africa
- Latin America
For inquiries regarding discounts, bulk purchases, or customization requests, please contact us at sales@precedenceresearch.com
Frequently Asked Questions





Ask For Sample
No cookie-cutter, only authentic analysis – take the 1st step to become a Precedence Research client
 Get a Sample




 sales@precedenceresearch.com
 Schedule a Meeting