


Vertical Farming Market Size, Key Companies, Company Market Share, Crop Production Volume, Yield Analysis, Export & Import Trends, Pricing Metrics, Competitive Positioning, and Demand Forecast
Laxmi Narayan, an Agriculture Industry Expert, reports that the vertical farming market reached USD 11,662.67 billion in 2026 and is forecast to reach USD 67,933.23 billion by 2035, expanding at a CAGR of 21.63%. Key vertical farming market companies including Plenty, Crop One, AeroFarms, are advancing the market across segments such as by category, by growth mechanism, by offering & component, by structure, by crop category (produce) and region.
Source: https://www.precedenceresearch.com/vertical-farming-market
 Get a Sample
 Table Of Content


What is the Vertical Farming Market Size?
The global vertical farming market size surpassed USD 9,630.13 million in 2025 and is predicted to increase from USD 11,662.67 million in 2026 to approximately USD 67,933.23 million by 2035, representing a CAGR of 21.63% from 2026 to 2035. The growth of the market is majorly driven by shrinking land for farming, a growing urban population, and growing demand for organic and pesticide-free foods.
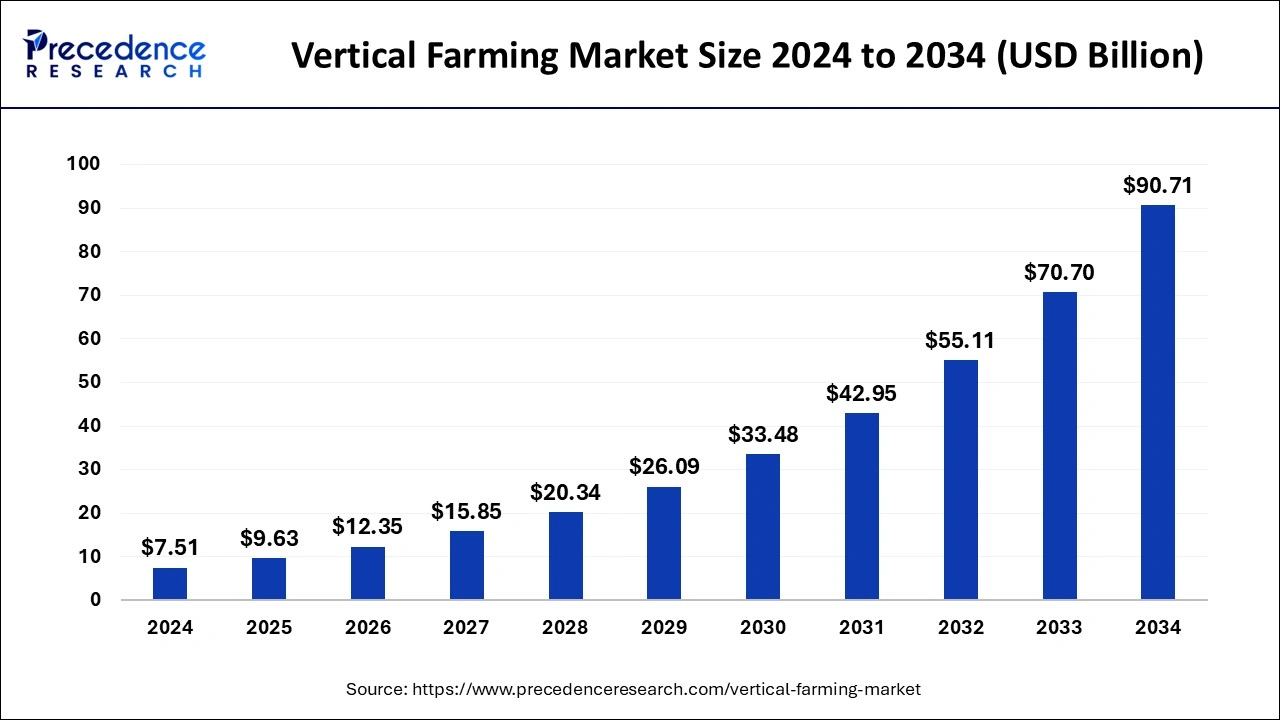
Vertical Farming Market Key Takeaways
- North America led the global market with the highest market share of 40.31% in 2025.
- By category, the CAPEX + OPEX segment has captured the largest revenue share of 71.87% in 2025.
- By structure, the Building-based segment has captured a revenue share of around 58.49% in 2025.
- By structure, the greenhouse-integrated segment is expected to expand at the fastest CAGR from 2026 to 2035.
- By growth mechanism, the hydroponics segment held a 60.36% revenue share in 2025.
- By growth mechanism, the aeroponics segment is expanding at the fastest CAGR between 2026 and 2035.
- By offering a component, the hardware segment held a 67.35% revenue share in 2025.
- By offering a component, the software segment is growing at a strong CAGR between 2026 and 2035.
- By crop category, the Leafy Greens segment holds the largest revenue share of 63.32% in 2025.
Overview - Food Security, Water Scarcity, and Premium Crops Are Shifting Value from Leafy-Greens Scale-Ups Toward Technology and High-Value Production
The global vertical farming market, spanning growing systems, LED lighting, climate control, market automation software, and controlled-environment production services, is estimated at approximately USD 7.5 billion in 2025 and is projected to reach USD 17 billion by 2030, a CAGR of about 18%. This adds roughly USD 9.5 billion of incremental revenue. The market grew at an estimated 20% CAGR between 2020 and 2025, but unevenly, as several venture-backed operators scaled faster than their unit economics allowed.
North America is the largest region at about 34% of value, though Asia Pacific is expected to overtake it by 2030. Leafy greens are the largest crop pool at about 52%, while strawberries and berries are the fastest-growing at about 30% annually. Vertical farms use up to 95% less water and deliver 10-20 times the yield per square meter of field production, yet energy still represents 25-30% of operating cost. The market is highly fragmented, with the top 10 participants holding an estimated 30-35% of value.
Key Coverage
- 2020-2030 value by crop, system, component, and region
- Base, upside, and downside forecasts
- Unit economics per kilogram and per square meter
- Concentration and maturity assessment
- Incremental revenue pools by crop and geography
Market Size - Asia Pacific and the Middle East Contribute Nearly Half of the USD 9.5 Billion Growth Opportunity
Market value rose from approximately USD 3 billion in 2020 to USD 7.5 billion in 2025. The base case assumes an 18% CAGR (USD 17 billion by 2030), the upside case 23% (about USD 21 billion), and the downside case 13% (about USD 14 billion), reflecting differences in power costs, capital availability, and premium-crop adoption. The long-range view is USD 30-33 billion by 2035.
| Region | 2025 Share | 2025–2030 CAGR (est.) |
| North America | ~34% | ~16% |
| Asia Pacific | ~31% | ~19% |
| Europe | ~22% | ~17% |
| Middle East & Africa | ~9% | ~24% |
| Latin America | ~4% | ~15% |
Asia Pacific and the Middle East & Africa together are expected to contribute nearly half of incremental revenue.
What is the U.S. Vertical Farming Market Size?
The U.S. vertical farming market size was estimated at USD 2,333.47 million in 2025 and is predicted to be worth around USD 13,474.58 million by 2035, at a CAGR of 19.58% from 2026 to 2035.
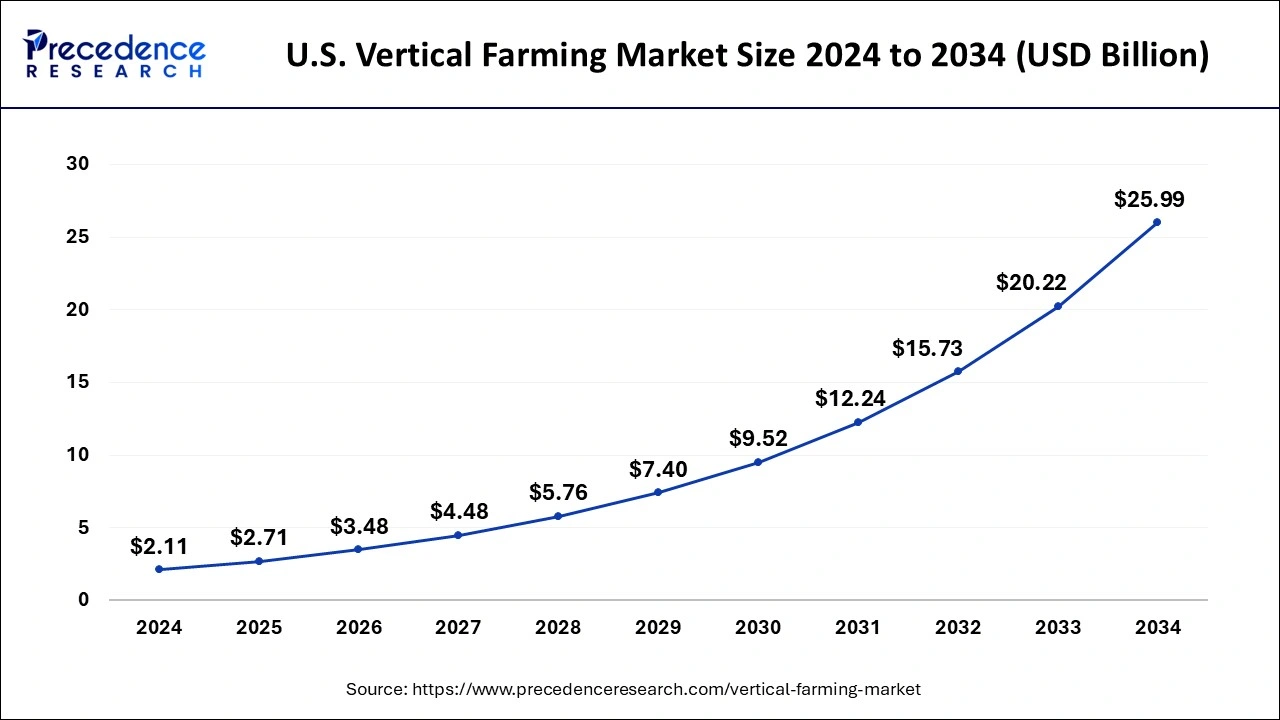
Key Coverage
- Historical and forecast value
- Regional and country forecasts
- Crop forecasts
- Three-scenario modeling
- Incremental opportunity by region.
Segmentation Analysis
Which Vertical Farming Segments Will Capture the Next Wave of Growth as the Leafy-Greens Core Matures?
By growing method, hydroponics holds about 60% of market value and is growing at about 17%, while aeroponics holds about 22% and is growing faster, at about 22%. Aquaponics (about 8%, 15% CAGR) and hybrid systems (about 10%, 19% CAGR) make up the rest. By crop, leafy greens account for about 52% of value but are growing at only about 15%, below the market average of about 18%. Herbs and microgreens (about 22% share, 17% CAGR), fruiting vegetables (about 7%, 22%), and other high-value crops such as ornamentals, cannabis, and pharmaceutical plants (about 10%, 20%) are growing faster. Strawberries and berries are the fastest-growing crop segment, at about 30% from a base of about 9%. By component, hardware represents about 62% of value, services and operations about 24%, and software and analytics about 14%, with software growing fastest at about 22%.
Our analysis indicates that the market is broadening rather than shifting away from leafy greens. Applying these segment growth rates to the 2025 base, our calculation suggests leafy greens will still contribute roughly 40% of incremental revenue through 2030, even as their share of total value falls toward 45%. Berries, by contrast, could roughly reach 14-15% of value by 2030 and contribute about a fifth of the market's USD 9.5 billion of growth. The pocket in decline is narrower than the crop category as a whole: commodity-style leafy greens in oversupplied metro markets. Aeroponics growth at about 22% points to technology-led differentiation, since higher water and nutrient efficiency and denser growing are being adopted on the crops where yield per square meter matters most. Software and analytics growing faster than hardware suggests operators are prioritizing energy and yield optimization over new floor space.
In our view, the most significant implication is that segment choice will matter more than scale. Operators and suppliers concentrated in commodity greens face slower growth and price pressure, while those positioned in berries, fruiting vegetables, aeroponic systems, and recurring-revenue software are aligned with the segments growing at 20% or more. From our assessment, this creates an opportunity for equipment suppliers and technology providers to sell into crop transitions, as existing leafy-greens facilities are retrofitted or repurposed toward higher-value crops. The main constraint is that berries and fruiting vegetables carry higher capital and horticultural complexity, so growth in these segments will likely be led by operators with proven crop recipes and strong retail relationships.
The full report quantifies value, share, and growth contribution across growing method, crop, and component, and adds segmentation by facility type, farm size, crop variety, light source, and end customer. It also identifies the highest-value, emerging, and declining pockets under base, upside, and downside scenarios.
The same segmentation intelligence is also available as a structured dataset. It can be filtered by crop, growing method, component, facility type, region, and year, with fields for market value, share, growth rate, and incremental revenue contribution. Analysts can use it to benchmark segment growth across regions, compare crop and system mix by market, and test how shifts in crop mix change revenue, complementing the strategic view in the report.
Are Vertical Farming's Growth Drivers Strong Enough to Outweigh Energy Costs and Capital Scarcity?
Demand is anchored by water scarcity, food import dependency, and retailer demand for year-round, pesticide-free local supply. The constraints are equally concrete. Electricity and labor together account for roughly 45-55% of operating cost, and a 10% rise in power prices lifts production cost by an estimated 2.5-3%. Capital has also tightened: insolvencies between 2023 and 2025 removed operators that had collectively raised well over USD 2 billion. Against this, lighting efficacy has improved sharply, with leading fixtures now exceeding 3.0 µmol/J versus roughly 1.7-2.0 for early generations.
Our analysis indicates that the demand drivers are structural, while the constraints are financial and depend largely on crop choice. Water scarcity and import dependency do not fade with the economic cycle, whereas power costs and capital access vary by region and by operator. The same 2.5-3% cost increase has very different consequences depending on the crop. On our calculation, it removes roughly two percentage points of gross margin from a leafy-greens operator already earning below 20%, but only about 1.5 points from a premium-crop operator earning 35-50%. Commodity greens also face high price elasticity, so costs are harder to pass on. We therefore see the 2023-2025 failures as a verdict on unit economics in commodity crops, not on the model itself.
In our view, the most significant implication is that capital will become selective rather than scarce. It is likely to flow to operators that demonstrate positive facility-level margins on higher-value crops, and to technology suppliers with recurring revenue that are less exposed to crop-price and power-price swings. Growth over the next five years will depend more on crop mix, energy efficiency, and localization than on adding capacity. From our assessment, this creates an opportunity for lighting, climate-control, and software providers whose products cut kilowatt-hours per kilogram, and for developers who secure low-cost renewable power. Operators with high energy exposure and no premium-crop pathway appear most vulnerable.
The full report quantifies the impact of each driver and restraint on the 2025-2030 forecast and models margin sensitivity to power prices by crop and region. It also assesses capital-availability scenarios, tracks the cost structure of operations, and evaluates how policy support and retailer demand shape localization across markets.
The same intelligence is also available as a structured dataset. It can track cost-stack components, energy intensity, power-price assumptions, capital raised, and insolvency events by country, crop, facility type, and year. Analysts can benchmark operating-cost structures across regions, test margin sensitivity to input costs, and monitor funding and failure patterns, complementing the strategic view in the report.
Key Coverage:
- Driver and restraint impact on the forecast
- Energy-price sensitivity
- Capital-availability scenarios
- Policy support by country.
Can Vertical Farms Sustain a Price Premium, or Do Crop Mix and Power Costs Decide Who Earns a Profit?
Production cost at mature facilities is an estimated USD 4-9 per kilogram for leafy greens, against roughly USD 1.5-3 for field production. Energy use ranges from about 8-20 kWh per kilogram, and capital cost from USD 1,500-4,000 per square meter of floor area. Retailers capture 25-35% of shelf price, and vertical-farm products carry a retail premium of roughly 20-50% over conventional packaged greens. Many operators still report gross margins below 20% on leafy greens, versus 35-50% on premium crops. Herbs, microgreens, and berries sell at several times leafy-green prices per kilogram, and renewable power contracts at USD 0.04-0.08 per kWh can cut electricity cost materially.
Our analysis indicates that profitability is determined by crop selection and energy sourcing, not by scale. By our calculation, the electricity bill ranges from about USD 0.3 per kilogram (8 kWh at USD 0.04) to about USD 1.6 per kilogram (20 kWh at USD 0.08). That spread of roughly USD 1.3 per kilogram is comparable to the entire production cost of field-grown greens, so an operator's position within this range can matter more than its selling price. The economics of commodity leafy greens are structurally difficult. Production cost is roughly two to three times the field benchmark, price elasticity is high, and the shelf premium is narrowing as local supply grows, which limits pass-through. Premium crops behave differently. Low price sensitivity in berries and specialty herbs allows operators to hold the premium and absorb energy costs, which explains the margin gap of 15–30 percentage points between the two groups.
In our view, the most significant implication is that pricing power will become more selective. We expect the retail premium on leafy greens to keep narrowing toward the 15-30% range, while operators that pair premium crops with lower power costs and better energy efficiency could improve gross margins by 5-10 percentage points. Capital intensity reinforces this. At USD 1,500-4,000 per square meter, a 5,000 square meter facility implies roughly USD 7.5-20 million of investment, so projects that cannot show a path to premium-crop margins will struggle to justify it. From our assessment, this creates an opportunity for lighting, climate-control, and software providers that cut kilowatt-hours per kilogram, and for developers that secure long-term renewable power contracts.
The full report quantifies price per kilogram by crop and region, breaks down the cost stack from energy, labor, and packaging to seed, nutrients, and retail margin, and estimates capital cost per square meter and per kilogram of annual output. It also models price pass-through and elasticity by crop, and provides a pricing and margin outlook under base, upside, and downside energy-cost scenarios.
The same pricing intelligence is also available as a structured dataset. It can be filtered by crop, region, facility type, channel, and year, with fields for price per kilogram, production cost, energy intensity, power price, capital cost, retailer margin, and gross margin. Analysts can benchmark cost positions across regions and crops, model margin sensitivity to power prices and yield, and test how shifts in crop mix change facility-level returns, complementing the strategic view in the report.
Demand-Supply Analysis - Gulf and Island Import Dependency Creates Deficits While US Leafy Greens Face Oversupply
Installed capacity is concentrated in North America, Japan, and the Gulf. Utilization at many facilities averages below 70% during ramp-up, and commissioning lead times run 12-24 months. Countries importing 80-90% of their food, including Gulf states and Singapore, are the clearest deficit markets, and national targets such as Singapore's goal of producing 30% of its nutritional needs locally by 2030 support import substitution. Japan alone hosts roughly 200 plant factories. Premium berries and herbs remain undersupplied, while leafy greens in some US metro markets show surplus capacity. Equipment trade is concentrated in lighting and climate systems from China and Europe.
Where Does Value Concentrate in the Vertical Farming Chain: With the Growers, or With the Technology Suppliers and Retailers Around Them?
The chain runs from seed and nutrient suppliers through equipment makers, facility operators, and distributors to retailers and foodservice. In capital cost LED lighting represents about 25-30%, climate control and dehumidification 20-25%, and growing systems and automation 25-30%. Operating costs split roughly 25-30% energy, 20-30% labor, 15-20% packaging and distribution, and 5-10% seed and nutrients. Lighting and climate-control suppliers earn EBITDA margins of an estimated 10-20%, while operators are largely at breakeven or below. Retailers capture a further 25-35% of shelf price. Bottlenecks include grid connection lead times and dehumidification capacity.
Our analysis indicates that value in this chain accrues to the stages that carry the least crop and energy risk. By our calculation, the three equipment categories account for roughly 70–85% of capital cost, so most of the money invested in new capacity flows to suppliers that earn 10–20% EBITDA margins whether or not the farm succeeds. Retailers take a quarter to a third of the shelf price without bearing production risk. Operators sit between the two, absorbing energy and labor costs that make up roughly half of operating cost, while selling into concentrated grocery buyers with limited pass-through room. Our assessment is that thin operator margins are a result of the chain's structure as much as of crop choice, and that the two combine to make commodity-crop operators the weakest link. Bottlenecks reinforce this. Grid connection and dehumidification constraints add to commissioning lead times of 12-24 months, and delays push back revenue while capital costs are already committed.
In our view, the most significant implication is that value will migrate toward suppliers with recurring revenue and toward operators that reduce their exposure at both ends. We expect the strongest positions to belong to technology providers that lower kilowatt-hours per kilogram, offer software and retrofit services, and supply dehumidification and climate systems in constrained markets. Among operators, those that lock in premium crops, direct retailer contracts, and long-term power supply appear best placed to capture margin. From our assessment, this creates an opportunity for developers with secured grid capacity and for equipment suppliers that shift from one-time hardware sales toward performance-linked or service-based models. Operators dependent on commodity greens, spot power, and a single retail customer appear most exposed.
The full report maps the cost and margin pool at each stage of the chain, from seed and nutrients through equipment, cultivation, distribution, and retail. It quantifies the capital and operating cost stack by facility type and region, supplier concentration by equipment category, and the lead times and constraints in grid access and automotive climate-control capacity. It also assesses how margin distribution may change under base, upside, and downside scenarios.
The same intelligence is also available as a structured dataset. It can track cost-stack components, stage-level margins, equipment shares, and lead times by region, crop, facility type, and year, with fields for capital cost per square meter, operating cost split, supplier margin, and retailer take. Analysts can benchmark value capture across stages and regions and test how shifts in energy price or crop mix move margin between operators and suppliers, complementing the strategic view in the report.
Which Technologies Will Do the Most to Close Vertical Farming's Cost Gap with Field Production?
Leading LED fixtures now exceed 3.0 µmol/J, compared with roughly 1.7-2.0 for early generations. Robotics technology can reduce labor by an estimated 20-40%, and AI-driven crop recipes have lifted yields by 10-20% in commercial deployments. Patent activity is concentrated in lighting spectra, nutrient delivery, and automation, while breeding of indoor-optimized cultivars is moving from pilot to scale.
Our analysis indicates that these technologies are commercially significant because each one targets a specific line of the cost stack. By our calculation, the efficacy gain means a fixture delivers roughly 50-75% more light per unit of electricity than early generations, or about one-third to two-fifths less electricity for the same photon output. Because energy is 25-30% of operating cost, this is the most direct lever on the cost base. Labor is 20-30% of operating cost, so a 20-40% reduction from robotics is worth roughly 4-12% of total operating cost. A 10-20% yield gain matters differently. Since much of the cost base is tied to floor area rather than output, it lowers cost per kilogram by roughly 9-17%. Our assessment is that lighting and yield optimization are the most reliable near-term gains, as they are proven in commercial use, whereas robotics returns depend on facility scale and crop type, and indoor-bred cultivars are still early.
In our view, the most significant implication is that technology will widen the gap between premium-crop and commodity operators rather than close it. Production cost for leafy greens is USD 4-9 per kilogram against roughly USD 1.5-3 for field production and even stacked efficiency gains are unlikely to bridge that gap on a commodity crop with high price elasticity. The same gains matter more on crops where price sensitivity is low and margins are already 35-50%. We also expect the largest commercial value to accrue to suppliers that convert efficiency into recurring revenue, such as retrofit lighting, control software, and crop-recipe services, and to breeding programs that produce cultivars suited to indoor conditions. From our assessment, this creates an opportunity for technology providers to sell performance-linked systems into existing facilities, as operators prioritize lowering kilowatt-hours and labor hours per kilogram over adding floor space.
The full report quantifies the cost impact of each technology by crop, facility type, and region, and assesses commercial maturity, adoption rates, and payback periods across lighting, climate control, automation, nutrient delivery, and software. It also analyzes patent activity by technology class, the pace of pilot-to-commercial scale-up for indoor-bred varieties, and the technology outlook under base, upside, and downside scenarios.
The same technology intelligence is also available as a structured dataset. It can track fixture efficacy, energy intensity, automation deployments, yield benchmarks, and patent filings by technology class, region, facility type, crop, and year. Analysts can benchmark technology performance across markets, test the effect of efficacy, labor, and yield assumptions on cost per kilogram, and monitor where innovation is concentrating, complementing the strategic view in the report.
Customer & Application Analysis - Grocery Retail Anchors Volume, While Life Sciences Offers Higher-Value Niches
Grocery retail accounts for about 48% of demand, foodservice and institutional buyers about 20%, food manufacturers and ingredients about 10%, direct-to-consumer about 7%, and pharmaceutical, nutraceuticals, and other uses about 15%. Operators typically derive 40-60% of revenue from their five largest customers. Buyers prioritize consistency, shelf life, and price parity, and switching costs are low in leafy greens but high where quality specifications are tight.
Competitive Landscape - Technology Suppliers, Premium-Crop Specialists, and Gulf and Asian Operators Gain While Leafy-Greens Pure Plays Restructure
The landscape has four groups: vertically integrated growers, lighting and climate-control suppliers, turnkey system providers, and regional operators in Asia and the Gulf. No participant exceeds an estimated 6-8% share. Scale players win on retail relationships and capital access, while technology suppliers win on installed base and recurring revenue. The full report profiles strategic positioning, revenue exposure, facility scale, and activity for each company.
Tentative Leading Company Universe
| Company | HQ | Market Position | Core Strength | Major Segments | |
| 1 | Plenty | US | Technology-led operator | Robotic high-density growing | Berries, leafy greens |
| 2 | AeroFarms | US | Aeroponic pioneer | Aeroponic IP | Leafy greens, herbs |
| 3 | 80 Acres Farms | US | Scaled operator | Automation, retail ties | Leafy greens, produce |
| 4 | Crop One | US/UAE | Scale leader | Large Gulf facility | Leafy greens |
| 5 | Oishii | US | Premium specialist | Indoor strawberries | Berries |
| 6 | Local Bounti | US | Hybrid-model leader | Stacked greenhouse-vertical | Leafy greens, herbs |
| 7 | Eden Green Technology | US | Vertical-greenhouse operator | Proprietary systems | Leafy greens |
| 8 | Spread | Japan | Plant-factory leader | Automation | Lettuce |
| 9 | Mirai | Japan | Plant-factory specialist | LED, factory design | Leafy greens |
| 10 | Jones Food Company | UK | European scale leader | Large-scale operation | Herbs, leafy greens |
| 11 | Vertical Future | UK | Technology specialist | Modular design | Leafy greens, R&D crops |
| 12 | Intelligent Growth Solutions | UK | Systems provider | Integrated tower systems | Turnkey farms |
| 13 | Growy | Netherlands | European challenger | Efficient cultivation | Leafy greens |
| 14 | Signify | Netherlands | Lighting leader | Horticulture LED breadth | Lighting systems |
| 15 | Fluence | US | Lighting specialist | High-efficacy LEDs | Lighting, controls |
| 16 | Heliospectra | Sweden | Lighting specialist | Spectral control | LED, controls |
| 17 | Priva | Netherlands | Climate-control leader | Climate and energy control | Climate systems, software |
| 18 | Certhon | Netherlands | Turnkey supplier | Integrated systems | Climate, growing systems |
| 19 | Sustenir Agriculture | Singapore | Regional operator | Premium Asian supply | Leafy greens, kale |
| 20 | Sky Greens | Singapore | Low-energy pioneer | Rotating towers | Leafy vegetables |
| 21 | Badia Farms | UAE | Gulf challenger | Local supply | Leafy greens, herbs |
| 22 | Sananbio | China | Chinese systems leader | Lighting scale | LED, plant factories |
| 23 | Agrify | US | Cultivation-tech specialist | Integrated units, analytics | Cannabis, high-value plants |
Competitive Benchmarking - Energy Efficiency, Crop Mix, and Retail Access Determine Advantage
Leaders are benchmarked on revenue, growth, EBITDA margin, cost per kilogram, energy intensity, yield per square meter, crop breadth, and capital raised, using Leader / Strong / Moderate / Emerging ratings.
- Portfolio: Broad hardware leaders (Signify, Priva, Certhon) contrast with premium-crop specialists (Oishii, Plenty) and hybrid operators (Local Bounti). Gaps appear in crop diversification beyond leafy greens.
- Technology: Lighting leaders exceed 3.0 µmol/J, while operators differentiate through robotics and AI optimization. Japanese and Chinese players lead in plant-factory automation.
- Application: Leafy greens are contested among Crop One, 80 Acres Farms, Spread, and Jones Food Company; berries are led by Oishii and Plenty; cannabis and high-value plants by Agrify.
- Geographic: Global suppliers compete across regions, while local champions lead at home: Spread and Mirai in Japan, Sananbio in China, Sustenir and Sky Greens in Singapore, Crop One and Badia Farms in the Gulf, and Jones Food Company in the UK.
- Manufacturing and capacity: Leading facilities reach about 30,000 square meters, such as the Dubai site producing roughly 1 million kilograms a year, while many smaller sites remain below 5,000 square meters.
- Customer and channel: Operators depend on grocery private-label and foodservice contracts; suppliers rely on grower relationships and greenhouse integrators.
Strategic Developments - Restructuring, Premium-Crop Pivots, and Gulf and Asian Expansion Reveal Future Priorities
Between 2023 and 2025, several once-prominent operators, including Kalera, Infarm, and Bowery, failed or exited, and Plenty restructured and refocused on strawberries. Meanwhile, large-scale Gulf facilities, hybrid greenhouse-vertical models, and energy partnerships have advanced. Oishii raised USD 134 million in 2022 to scale indoor berries.
M&A Landscape - Distressed Consolidation and Technology Acquisitions Are Reshaping Structure
Consolidation is driven by distressed asset sales, acquisition of automation and controls capabilities by lighting and high-end greenhouse technology groups, and sovereign and strategic investment from the Gulf and Asia. Future themes include berry and premium-crop assets, technology roll-ups, and retailer-backed vertical integration. The full report tracks deal values, revenue multiples, and expected next targets.
Company Profiles and Strategic Positioning - Which Competitors Are Best Placed?
Each of the 23 profiles covers ownership, employees, and segments; revenue, growth, and margin; crop and technology portfolio; facility footprint; strategic developments; and strengths and vulnerabilities. Reference points include Plenty's nearly USD 1 billion of capital raised and Local Bounti's annual revenue of roughly USD 50 million. The assessment classifies companies as Scale Leaders (Crop One, Signify), Technology Leaders (Priva, Fluence, Sananbio), Growth Leaders (Oishii, Plenty), Regional Leaders (Spread, Jones Food Company), and Emerging Challengers (Badia Farms, Growy). Best-positioned players combine premium-crop focus, low-cost energy, and retail partnerships.
Opportunity & White-Space Analysis - Premium Crops, Gulf Import Substitution, and Energy-Efficient Retrofits Offer the Highest-Value Openings
The report identifies opportunities in strawberries and berries (about 30% CAGR), Gulf and Southeast Asian import substitution, pharmaceutical and nutraceutical plants, software and analytics (about 22% CAGR), and renewable-powered facilities. It also quantifies the penetration gap between the top import-dependent markets and the current installed base.
Industry Structure, PESTLE, and Attractiveness - Low Barriers to Entry, Rising Cost Pressure
- Five Forces: Supplier power is Medium (concentrated lighting and climate equipment). Buyer power is High (large grocery chains). Threat of new entrants is Medium (capital-intensive but technology is accessible). Threat of substitutes is Medium (field and greenhouse produce). Rivalry is High.
- PESTLE: Food-security policy, energy prices, water scarcity, capital-market appetite, LED and automation advances, and organic and food-safety rules are the most material forces.
- Attractiveness: Berries, Gulf expansion, and lighting and software are Highly Attractive. Herbs, microgreens, and Asian markets are Attractive. Commodity leafy greens in mature markets are Moderate. Energy-exposed operators in high-tariff regions are Challenging.
Future Outlook - Efficient, Premium-Crop, and Technology-Led Players Will Capture the Profit Pools
The market is projected to reach approximately USD 17 billion by 2030 (base), with USD 30-33 billion by 2035. The upside case (about 23% CAGR) assumes lower power costs and renewed capital; the downside (about 13%) reflects prolonged financing constraints. Gross margins could improve 5-10 percentage points as energy efficiency rises, while the retail premium narrows toward 15-30%. Consolidation is likely around technology suppliers, berries, and Gulf capacity.
Recent Developments
- On May 4, 2025, the study of the cultivation of six food groups in vertical farming, investigated by a research team led by TUMCREATE in Singapore, a research platform affiliated with the Technical University of Munich (TUM), as part of the Proteins4Singapore project, has been reported. The six food groups in vertical farming include crops, algae, mushrooms, insects, fish, and cultivated meat.
- On May 1, 2025, the Vertical Farm at Illinois State University officially opened to train and prepare students for careers in agriculture and horticulture specialty crop production, and as a demonstration site for local community groups, schools, and business entrepreneurs. The $200,000 project is a joint partnership of The College of Applied Science and Technology, Department of Agriculture, and Office of Sustainability, located adjacent to the Office of Sustainability at 305 North School Street, Normal, Illinois.
- In January 2025, GoodLeaf Farms secured funding from Farm Credit Canada (FCC) to help the company expand its vertical farming operations across Canada.
Vertical Farming Market Segments Covered in the Report
By Category
- CAPEX + OPEX
- Produce Revenue
By Growth Mechanism
- Hydroponics [Mineral-based liquid solution]
- Aeroponics [Nutrient mist/fog]
- Aquaponics [Integrated fish/aquatic ecosystem]
- Substrate-based [Inert media like coco-coir/rockwool]
By Offering & Component
- Hardware
- Lighting
- HVAC
- Irrigation
- Racks & Shelving
- Software [AI-driven Farm Management Systems]
- Services
- System Integration
- Consulting
- Maintenance & Managed Operations
By Structure
- Building-based [Warehouses, repurposed urban spaces]
- Container-based [Modular shipping containers]
- Greenhouse-Integrated [Rooftop or hybrid sunlight facilities]
- In-Store/Point-of-Sale [Small-scale retail display units]
By Crop Category [Produce]
- Leafy Greens
- Lettuce
- Spinach
- Kale
- Arugula
- Herbs & Microgreens
- Basil
- Cilantro
- Immature Shoots
- Fruiting Crops
- Tomatoes
- Berries
- Peppers
- Cucumbers
- Flowers & Ornamentals
- Edible Flowers
- Perennials
- Others
- Root Vegetables
- Fodder
- Cannabis
By Region
- North America
- U.S.
- Canada
- Europe
- Germany
- France
- United Kingdom
- Rest of Europe
- Asia Pacific
- China
- Japan
- India
- Rest of Asia Pacific
- Latin America
- Brazil
- Rest of Latin America
- Middle East & Africa (MEA)
- GCC
- North Africa
- South Africa
- Rest of Middle East & Africa
For inquiries regarding discounts, bulk purchases, or customization requests, please contact us at sales@precedenceresearch.com
Frequently Asked Questions
Tags





Ask For Sample
No cookie-cutter, only authentic analysis – take the 1st step to become a Precedence Research client
 Get a Sample




 sales@precedenceresearch.com
 Schedule a Meeting