Lithium-ion Battery Market Trends, Leading Companies, Company Revenue / Sales Performance, Manufacturing Capacity, Production Cost, Supply Chain Performance, Pricing Analysis, Competitive Landscape, and Industry Outlook
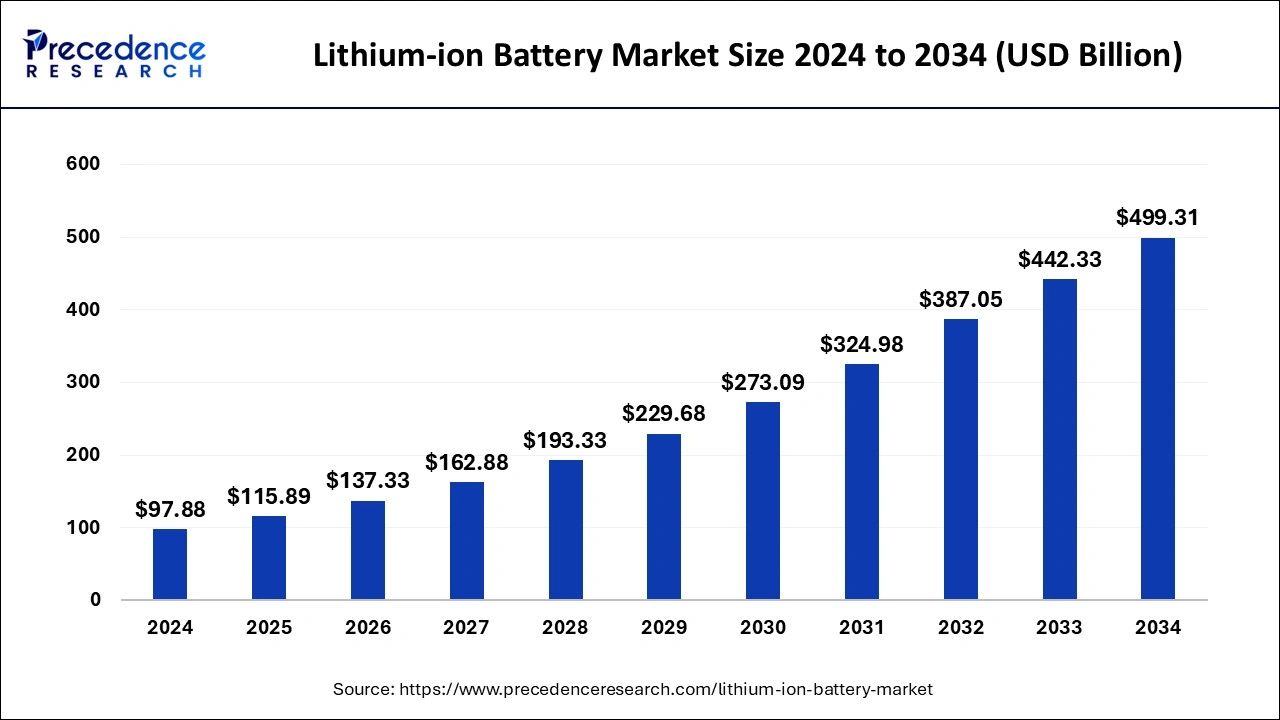
The global lithium-ion battery market exceeded USD 137.33 billion in 2026, with electric vehicles, stationary storage, consumer electronics, industrial equipment, and data-center backup all adding demand. EV battery deployment reached about 1.2 TWh, and LFP made up more than 55% of it. China produced over 80% of global cells. Falling battery prices, gigafactory expansion, new chemistries, localization, recycling rules, and rising storage deployment are changing industry economics, with large GWh additions expected through 2035.
Source: https://www.precedenceresearch.com/lithium-ion-battery-market
 Get a Sample
 Table Of Content


What is the Lithium-ion Battery Market Size?
The global lithium-ion battery market size is USD 137.33 billion in 2026 to approximately USD 555.15 billion by 2035, expanding at a CAGR of 16.96% from 2026 to 2035. The increasing demand for electric vehicles, the rising adoption of smartphones, and growing disposable income drive the lithium-ion battery market.
Overview - Lithium-ion Batteries are Shifting From an EV-Centric Market to a Multi-Application Energy Platform
Electric mobility, grid storage, consumer electronics, industrial equipment, and digital infrastructure all kept battery demand rising. EV batteries alone reached about 1.2 TWh of deployment in 2025, over 70% of the global total. Stationary storage is the biggest growth engine: it added 108 GW of battery capacity worldwide in 2025, 40% more than in 2024. (IEA)
The market is also fragmenting by chemistry, geography, and application. LFP accounted for over 55% of global EV battery deployment in 2025 and about 90% of battery-storage deployments, while China produced more than 80% of global battery cells and held roughly 85% of cell manufacturing capacity. (IEA)
Our analysis covers more than cells: materials, electrodes, modules, packs, battery-management systems, storage systems, recycling and application-specific integration all sit within scope.
Key Coverage
- EV deployment of approximately 1.2 TWh
- Stationary-storage additions of 108 GW
- LFP penetration exceeding 55% in EVs
- China accounting for >80% of cell production
- Chemistry, form factor and application economics
- Global capacity, utilization and localization
- Competitive positioning and emerging technology pathways
Market Size and Forecast - Volume Growth is Accelerating Faster Than Revenue as Battery Economics Continue to Decline
The market is estimated to have grown from USD XX billion in 2024 to more than USD XX billion in 2025, even as prices kept falling. Average lithium-ion battery-pack prices dropped to about USD 108/kWh in 2025, roughly 8% below the prior year. With GWh volumes rising while $/kWh falls, manufacturers need scale, high utilization, chemistry optimization, and vertical integration, because price increases are no longer a source of growth. (Bloomberg New Energy Finance)
The full report forecasts revenue and GWh from 2020 to 2035 for EV, stationary storage, consumer electronics, and industrial applications, with base, upside, and downside cases built on EV penetration, storage deployment, commodity prices, plant utilization, and battery-price paths.
Key Coverage
- Application-specific CAGR
- Regional contribution
- Chemistry-driven growth scenarios
- Battery-price sensitivity
- Base/upside/downside scenarios
Segmentation Analysis - LFP Leads on Volume, While High-Nickel Chemistries Hold the High-Performance Niches
Chemistry now ranks among the biggest competitive variables. LFP passed 55% of global EV battery deployment in 2025, while nickel-containing chemistries held on in applications that put energy density and vehicle range first. In stationary storage, LFP's roughly 90% share reflects its edge on cost, safety, and cycle life. (IEA)
Demand is segmented by chemistry (LFP, NMC, NCA, LCO, LMO, LTO and emerging types), by cell format (cylindrical, prismatic, pouch) and by application: passenger EVs, commercial vehicles, two-wheelers, consumer electronics, grid storage, commercial/industrial storage, UPS, power tools and industrial mobility.
Key Coverage
- Chemistry market share and GWh
- Cell-format economics
- EV versus ESS demand
- Consumer-electronics battery demand
- Fastest-growing applications
- Regional chemistry preferences
- Emerging sodium-ion and solid-state pathways
Market Dynamics - Competitive Advantage Now Comes from Scale, Cost Curves, and Localization
The main driver is transport electrification paired with fast renewable-energy deployment. EV battery deployment grew almost 30% in 2025, and electric-truck battery demand more than doubled. Storage has also moved beyond ancillary services: energy shifting accounted for over 90% of new storage projects in 2025. (IEA)
The main restraints run just as deep: manufacturing overcapacity, price competition, raw-material volatility, financing needs, qualification cycles, and geographic concentration. The report tests each against battery-price elasticity, capacity utilization, raw-material sensitivity, EV penetration, storage economics, and regional policy exposure.
Key Coverage
- EV electrification
- Renewable-storage integration
- Battery-price deflation
- Manufacturing overcapacity
- Raw-material volatility
- Localization requirements
- Technology substitution
- Capacity-utilization economics
Pricing Analysis - Falling $/kWh Prices are Widening Battery Adoption and Squeezing Manufacturer Margins
Average lithium-ion pack prices fell to about $108/kWh in 2025, from more than $118/kWh in 2024. Manufacturing scale, intense competition, LFP adoption, and better production economics drove the drop. (Bloomberg New Energy Finance)
Beyond headline pricing, the report breaks down cell versus pack prices, LFP versus nickel-rich economics, format premiums, regional price gaps, raw-material pass-through, manufacturing cost, logistics, integration margins, and storage-project economics.
Key Coverage
- $/kWh historical pricing
- Cell-to-pack value capture
- Chemistry premiums
- Regional pricing
- Raw-material exposure
- Manufacturing cost curves
- Margin sensitivity
- 2030 pricing outlook
Demand-Supply and Capacity - Global Manufacturing Capacity Remains Far Above Current Demand
Global battery-cell manufacturing capacity exceeded 3 TWh in 2024, roughly three times combined EV and storage demand, with China holding about 85% of it. Committed projects could lift capacity to around 6.5 TWh by 2030, before counting the larger pipeline of announced projects. (IEA)
Installed capacity is different from economically competitive capacity, and the report treats them separately. It evaluates utilization, plant economics, regional overcapacity, commissioning schedules, localization, and the odds that announced projects reach commercial production.
Key Coverage
- Global GWh capacity
- Utilization rates
- Capacity pipeline
- Regional supply-demand balance
- Manufacturing localization
- Overcapacity exposure
- Import dependency
- Capacity economics
Value Chain, Supply Chain & Trade - Materials and Components Matter as Much as Cell Manufacturing
The lithium-ion battery value chain spans lithium, nickel, cobalt, manganese and graphite; refining; cathode and anode materials; separators; electrolytes; current collectors; cell manufacturing; modules; packs; BMS; charging/storage integration; and recycling.
China's position extends upstream. In 2025 it accounted for about 85% of cathode active-material production and over 90% of anode active-material production for EV batteries. Countries building domestic battery supply chains are exposed to that concentration. (IEA)
The report maps cost and margin pools at each stage and quantifies bottlenecks, import dependency, localization opportunities, and cross-border trade flows.
Key Coverage
- Raw-material exposure
- Cathode/anode economics
- Component concentration
- Cell-to-pack value creation
- Import/export flows
- Localization
- Logistics and bottlenecks
Technology and Innovation - Which Battery Technologies are Most Likely to Reshape Performance, Cost, and Competitive Advantage Over the Next Decade?
Lithium-ion innovation has advanced beyond minor chemical modifications, focusing on energy density, charging speed, cycle life, thermal safety, manufacturing yield, and critical-material efficiency. LFP has become a dominant choice, representing over 55% of global EV battery deployments and about 90% of battery-storage deployments in 2025. High-nickel chemistries still serve applications where energy density matters most. The market is heading toward technology divergence, not a single winning chemistry. LFP will likely stay structurally important for cost-sensitive EVs and stationary storage, while higher-energy-density platforms keep their place in premium mobility and other space-constrained uses.
The next competitive edge will come from combining chemistry, cell architecture, charging capability, and manufacturing process. Cell-to-pack integration, larger-format cells, high-voltage architectures, silicon-rich anodes, dry-electrode manufacturing and advanced thermal management all aim at higher energy density, fewer components, faster charging and lower cost. Fast charging and manufacturing efficiency are the nearest-term battlegrounds: charging performance directly shapes EV usability, while higher yield and lower material intensity create lasting $/kWh advantages. Manufacturers with strong process engineering and the ability to commercialize at volume may capture more value than companies that rely on laboratory breakthroughs.
Solid-state and sodium-ion technologies should be judged on commercialization economics rather than novelty. Solid-state batteries promise higher energy density and better safety, but manufacturing scalability, material compatibility, cycle performance, and cost remain unresolved. Sodium-ion could gain ground where lower material costs, supply-chain diversification and storage economics outweigh lithium-ion's energy-density advantage. Both are more likely to widen the technology mix than to displace mainstream lithium-ion everywhere. The full report assesses maturity, energy density, charging performance, cycle life, safety, manufacturing complexity, cost trajectories, commercialization timelines, patent activity, R&D intensity and application fit across LFP, high-nickel, silicon-anode, sodium-ion and solid-state platforms.
The same intelligence can also be delivered as a technology intelligence database tracking technology/chemistry, cell architecture, energy density, charging time, cycle life, anode/cathode materials, manufacturing process, commercialization stage, patent activity, R&D investment, application, geography, cost trajectory, and deployment status. Users can filter by maturity and application, benchmark pathways across manufacturers, and spot where advances are most likely to bring cost or performance gains.
Key Coverage
- LFP and high-nickel evolution
- Silicon-anode adoption
- Fast charging
- Solid-state commercialization
- Sodium-ion development
- Cell-to-pack integration
- Manufacturing innovation
Regulation and Sustainability - Regulation Now Holds Batteries Accountable Across Their Full Lifecycle
Regulatory requirements now cover carbon footprint, sourcing, recycled content, producer responsibility and end-of-life recovery. In Europe, recycling and material-recovery rules keep tightening: recycling efficiency for lithium-based batteries had to reach 65% by the end of 2025 and rises to 70% by 2030, while lithium recovery targets climb from 50% in 2027 to 80% in 2031. (Environment)
The report reviews how these requirements affect chemistry choice, procurement, recycling economics, traceability, manufacturing localization, and total battery cost.
Key Coverage
- Battery carbon footprint
- Recycling requirements
- Critical-mineral recovery
- Recycled content
- Supply-chain traceability
- Producer responsibility
- Circular-economy economics
Customer & Application Analysis - EVs Lead on Volume While Storage and Data Centers Open New Demand Pools
EVs remained the largest battery application in 2025, with over 70% of deployment. Stationary storage is growing fast, though: utility-scale projects made up roughly four-fifths of 2025 storage additions. Battery-based UPS additions also reached about 45 GW in 2025, driven by data-center demand. (IEA)
The report examines buying criteria (cost per kWh, energy density, cycle life, degradation, safety, charging speed, warranty, total cost of ownership, and qualification requirements) across automotive OEMs, storage developers, electronics makers, and industrial customers.
Key Coverage
- EV application economics
- Stationary storage
- Data-center UPS
- Consumer electronics
- Commercial/industrial mobility
- Customer qualification
- Channel structures
- Switching barriers
Competitive Intelligence
Competitive Landscape - Industry Leadership is Concentrated Among Suppliers with Scale, Global Footprints and Chemistry Flexibility
The global EV battery market is highly concentrated. Installations reached about 1,187 GWh in 2025, led by CATL with 39.2% (464.7 GWh) and BYD with 16.4% (194.8 GWh). Together they held 55.6%, and the top 10 suppliers held about 89.5%. Scale, capacity, technology, and customer relationships explain much of that lead. (CnEVPost)
Capacity expansion alone no longer decides the race. Suppliers now compete on cost per kWh, overseas plants, ESS exposure, LFP capability, customer diversification, fast charging, vertical integration, and next-generation technology.
Tentative Leading Company Universe
| Company | Headquarters | Market Position | Core Strength | Major Applications |
| CATL | China | Global scale leader | Cell technology, scale, ESS | EV, ESS |
| BYD | China | Integrated challenger/leader | Vertical integration | EV, ESS |
| LG Energy Solution | South Korea | Global diversified supplier | Pouch/cylindrical, ESS | EV, ESS |
| CALB | China | Large Chinese supplier | LFP/prismatic | EV, ESS |
| Gotion High-Tech | China | Global challenger | LFP, localization | EV, ESS |
| SK On | South Korea | High-performance supplier | High-nickel cells | EV |
| Panasonic | Japan | Cylindrical specialist | High-energy-density cells | EV, industrial |
| EVE Energy | China | Fast-growing supplier | Cylindrical/prismatic | EV, ESS |
| Samsung SDI | South Korea | Premium technology player | High-nickel/next-gen | EV, ESS |
| SVOLT Energy | China | Emerging global player | LFP/high-nickel | EV, ESS |
| Sunwoda | China | Diversified battery supplier | Consumer/EV/ESS | Electronics, EV |
| Envision AESC | Japan/Global | Automotive specialist | Global production | EV |
| Farasis Energy | China | Technology specialist | Pouch cells | EV |
| REPT Battero | China | ESS/EV challenger | LFP/prismatic | ESS, EV |
| Northvolt-related assets/businesses | Europe | European supply-chain participant | Localized manufacturing | EV, ESS |
| Amperex Technology | China | Consumer-battery specialist | High-density cells | Electronics |
| Automotive Cells Company | Europe | European JV platform | Automotive cells | EV |
| Verkor | France | European challenger | Low-carbon cells | EV |
| Morrow Batteries | Norway | European emerging player | LFP/localized production | ESS, EV |
| Saft | France | Industrial battery specialist | Industrial applications | Storage, industrial |
| Prime Planet Energy & Solutions | Japan | Automotive JV supplier | Prismatic cells | EV |
This is a tentative market-relevant universe rather than a definitive ranking.
Market Share & Competitive Ranking - The Top Two Suppliers Control More Than Half of Global EV Battery Deployment
CATL and BYD lead the 2025 EV battery installation ranking by a wide margin, followed by LG Energy Solution at 9.2% (108.8 GWh). The rest of the top 10 runs from CALB at 5.3% down to SVOLT at 2.4%, as the table shows. (CnEVPost)
| Rank | Company | Share | GWh |
| 1 | CATL | 39.20% | 464.7 |
| 2 | BYD | 16.40% | 194.8 |
| 3 | LG Energy Solution | 9.20% | 108.8 |
| 4 | CALB | 5.30% | 62.8 |
| 5 | Gotion | 4.50% | 53.5 |
| 6 | SK On | 3.70% | 44.5 |
| 7 | Panasonic | 3.70% | 44.2 |
| 8 | EVE | 2.60% | 31.3 |
| 9 | Samsung SDI | 2.40% | 28.9 |
| 10 | SVOLT | 2.40% | 28.5 |
The full report keeps EV installation share separate from total lithium-ion share, so EV rankings are not read across to ESS, consumer, or industrial batteries.
Competitive Benchmarking - Scale Alone No Longer Separates the Leaders
Leading suppliers in the market vary in profitability, chemistry mix, geographic spread, plant utilization, and technology. In 2025, CATL reported revenue of RMB 423.7 billion, lithium-battery sales of 661 GWh, production capacity of 772 GWh, and R&D spending of RMB 22.1 billion. (CATL)
LG Energy Solution reported 2025 consolidated revenue of KRW 23.7 trillion and operating profit of KRW 1.3 trillion and made energy storage (ESS) a much larger part of its business. It targeted more than 60 GWh of global ESS capacity in 2026, over 80% of it in North America, and ended 2025 with an ESS order backlog of about 140 GWh. (LG)
The benchmarking framework covers market share, revenue growth, profitability, capacity, utilization, R&D, chemistry breadth, ESS exposure, customer concentration, international footprint, and localization.
Product Portfolio & Technology Benchmarking - Leading Portfolios Now Center on LFP, High-Nickel and Large-Format Cells
Leading suppliers' portfolios now include LFP, NMC, cylindrical 46-series, large prismatic, pouch, high-voltage mid-nickel, and early sodium-ion products. Differentiation now comes down to charging time, cycle life, thermal management, safety, and system-level integration.
The report benchmarks product portfolios, patents, R&D expenditure, commercialization stage, strategic partnerships, and technology roadmaps across the leading company universe.
Application & Geographic Competition - Battery Plants are Being Built Closer to Customers
China produced more than 80% of battery cells in 2025, while Korean and Japanese manufacturers keep building large overseas footprints. Committed projects could cut China's share of global manufacturing capacity from about 85% in 2024 to around two-thirds by 2030, though ownership is expected to stay concentrated among established Asian manufacturers. (IEA)
The report benchmarks North America, Europe, China, Japan, Korea, India, and Southeast Asia by capacity, customer access, localization, incentives, supply-chain depth, and manufacturing economics.
Manufacturing & Capacity Benchmarking - Announced Capacity Must Be Distinguished from Competitive Capacity
Capacity economics increasingly decide outcomes. CATL reported about 772 GWh of global battery-cell production capacity at the end of 2025, with another 321 GWh under construction. (CATL)
The report maps plant locations, announced capacity, commissioning dates, utilization, chemistry, customer allocation and localization intensity to separate capacity likely to earn returns from structurally underused assets.
Customer & Channel Benchmarking - Long-Term OEM Contracts Now Work as Strategic Assets
Customer relationships now involve multi-year supply agreements, joint ventures, localized production, and technology co-development. SK On's North American agreement with Nissan, for example, covers nearly 100 GWh of battery supply from 2028 through 2033. (SK)
The report benchmarks OEM concentration, order backlogs, direct sales, partnerships, technical support, qualification barriers, and customer diversification.
Strategic Developments & M&A - Capital is Going Into ESS, Localization and Technology
Recent activity has moved from broad capacity expansion to ESS production, LFP localization, manufacturing optimization, cylindrical formats, recycling, and next-generation chemistry. LG Energy Solution, for one, is reallocating EV capacity toward ESS and adapting production lines to different chemistries and form factors. (LG)
M&A analysis tracks acquisitions, joint ventures, recycling integration, technology deals, and regional manufacturing partnerships, and shows where consolidation is tightening control over critical materials and customers.
Company Profiles & Strategic Positioning - Scale Leaders are Taking Different Routes to Growth
Profiles for all 21 companies cover revenue, battery exposure, share, capacity, footprint, chemistry, applications, R&D, patents, customers, profitability, strategic investments, and M&A.
The positioning framework groups companies as scale leaders, technology leaders, regional leaders, ESS specialists, automotive specialists, and emerging challengers, with no single score behind the grouping.
Opportunity & White-Space Analysis - The Biggest Opportunities Sit in Storage, Localization and Advanced Cells
The report identifies opportunity pools in LFP localization, four-hour-plus storage, fast charging, premium high-energy-density cells, recycling, battery-management systems, silicon anodes, localized component supply and emerging-market manufacturing.
Stationary storage stands out. Global battery-storage additions reached 108 GW in 2025, and average project duration lengthened toward three hours, which enlarges the market for energy-shifting applications. (IEA)
Industry Structure & PESTLE - High Capital Intensity and Supply-Chain Concentration Raise Entry Barriers
- Supplier power: High. Lithium, graphite, cathode materials and specialized equipment remain concentrated.
- Buyer power: High. Large automotive and storage customers bargain hard and now demand local production.
- New entrants: Low-Medium. Know-how, qualification, capex and yield create major barriers.
- Substitutes: Medium. Sodium-ion and other storage technologies are emerging, but lithium-ion keeps broad commercial scale.
- Rivalry: High. Capacity growth, price competition and fast chemistry transitions keep pressure on.
The PESTLE analysis also evaluates trade policy, EV incentives, interest rates, raw-material prices, electrification, AI/data-center demand, battery technology, recycling regulation, and environmental requirements.
Market Attractiveness - Growth Potential is Highest Where Falling Battery Costs Meet Electrification Demand
Attractiveness differs sharply by application and geography. EVs are the largest established demand pool, stationary storage is among the fastest-growing incremental pools, high-performance cells keep premium potential, and recycling is a strategically important future feedstock market.
The report scores attractiveness on market size, CAGR, margin potential, customer concentration, technology barriers, capacity requirements, regulation, supply-demand balance, and localization economics.
Future Outlook - The Next Phase Will Be Defined by GWh Scale, Lower $/kWh and a Broader Application Mix
The base case expects strong battery-volume growth through 2030 as EV penetration climbs, stationary storage expands, and batteries become more central to digital infrastructure. The upside case assumes faster EV adoption, quicker storage deployment, and successful commercialization of higher-performance cells. The downside case assumes prolonged manufacturing overcapacity, slower EV demand, weaker pricing, and delayed project commissioning.
Building the most capacity will matter less than operating competitive capacity at the lowest delivered cost while meeting localization, technology, and sustainability requirements.
Key Strategic Questions Addressed
- How large is the global lithium-ion battery market in revenue and GWh terms?
- How quickly will EV and stationery-storage demand expand through 2030 and 2035?
- Which chemistries will capture the largest incremental battery volumes?
- How quickly will LFP displace higher-cost nickel-rich chemistries?
- Where will battery prices and $/kWh economics settle?
- Which regions face structural battery overcapacity or supply shortages?
- How will China's manufacturing dominance evolve through 2030?
- Which raw materials represent the greatest supply-chain vulnerabilities?
- How will recycling regulation affect battery economics and material supply?
- Which applications will create the fastest-growing incremental GWh demand?
- Which manufacturers control the largest EV battery revenue pools?
- How do leading companies compare on capacity, technology, profitability, and geography?
- Which manufacturers are best positioned across EV, ESS, and emerging applications?
- Where are the largest geographic, technology, and application white spaces?
- How will solid-state, sodium-ion, silicon-anode, and next-generation lithium-ion technologies reshape the market through 2035?
Lithium-ion Battery Market Segments
By Battery Type
- Lithium Cobalt Oxide (LCO)
- Lithium Nickel Manganese Cobalt Oxide (NMC)
- Lithium Iron Phosphate (LFP)
- Lithium Nickel Cobalt Aluminum Oxide (NCA)
- Lithium Manganese Oxide (LMO)
- Lithium Titanate Oxide (LTO)
- Other Lithium-ion Chemistries
By Battery Form
- Cylindrical
- Prismatic
- Pouch
By Capacity
- Below 10 Ah
- 10-50 Ah
- 51-100 Ah
- Above 100 Ah
By Component
- Cathode
- Anode
- Electrolyte
- Separator
- Current Collector
- Battery Management System
- Other Components
By Application
- Electric Vehicles
- Passenger Cars
- Commercial Vehicles
- Buses
- Two- and Three-Wheelers
- Consumer Electronics
- Smartphones
- Laptops/Tablets
- Wearable Devices
- Other Electronics
- Energy Storage Systems
- Utility-Scale Storage
- Commercial & Industrial Storage
- Residential Storage
- UPS/Data Centers
- Industrial
- Material Handling Equipment
- Power Tools
- Robotics
- Industrial Equipment
- Other Applications
By Battery Architecture
- Cell-to-Module
- Cell-to-Pack
- Cell-to-Chassis
- Module-Based Systems
By End Use
- Automotive
- Consumer Electronics
- Energy & Utilities
- Industrial
- Telecommunications
- Aerospace & Defense
- Other End Uses
By Region
- North America
- U.S.
- Canada
- Mexico
- Europe
- Germany
- France
- U.K.
- Italy
- Spain
- Netherlands
- Sweden
- Norway
- Rest of Europe
- Asia Pacific
- China
- Japan
- South Korea
- India
- Southeast Asia
- Australia
- Rest of Asia Pacific
- Latin America
- Brazil
- Mexico
- Argentina
- Rest of Latin America
- Middle East & Africa
- GCC
- South Africa
- Rest of Middle East & Africa
For inquiries regarding discounts, bulk purchases, or customization requests, please contact us at sales@precedenceresearch.com
Frequently Asked Questions
Tags





Ask For Sample
No cookie-cutter, only authentic analysis – take the 1st step to become a Precedence Research client
 Get a Sample




 sales@precedenceresearch.com
 Schedule a Meeting