Blood Filtration and Purification Market Size, Share, Trends, Segmentation, Key Companies, and Forecast, 2026-2035
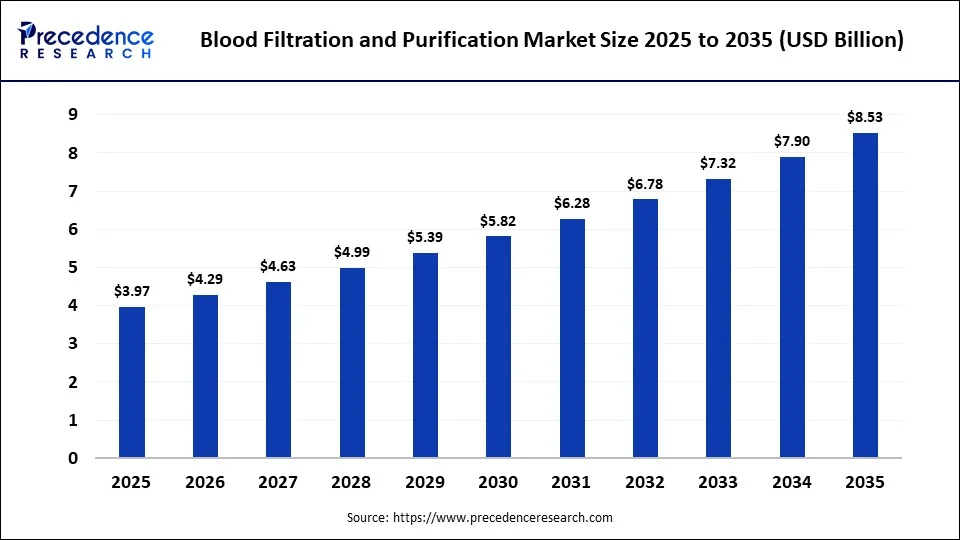
Deepa Pandey is a healthcare market research analyst. She researched the market trends in blood filtration and purification technologies, therapeutic uses, product adoption, and regulatory and clinical advances. As a researcher, she helps medical device companies, healthcare systems, blood processing companies, and investors benchmark and develop decision-making strategies. The blood filtration and purification market reached USD 4.29 billion in 2026.
Source: https://www.precedenceresearch.com/blood-filtration-and-purification-market
 Get a Sample
 Table Of Content


Blood Filtration and Purification Market Size and Forecast 2026 to 2035
Encompassing blood filtration and blood purification, the field has grown more advanced in clinical settings. Deepa Pandey has more than 5 years of experience in medical device & blood-processing technology for healthcare analysis. She analysed a wide range of aspects, from patient experiences and the spread of extracorporeal purification technology to the ongoing progress in purification membranes and system components.
The field of blood purification procedures needs to selectively remove harmful substances while preserving essential components for effective, efficient therapies. The global value of the blood filtration and purification market is expected to grow at a CAGR of 7.95% throughout the forecast period.
Key Takeaways
- By product, the filtration kits and reagents segment led the market with a share of 34.20% in 2026.
- By application, the infectious disease diagnostics segment led the market with a 29.75% share in 2026.
- By end user, the clinical diagnostics laboratories segment captured a major revenue share of 43.8% in 2026.
- By region, the North America segment captured the largest market share of 41.3% in 2026.
- The number of patients with CKD grew by 54 million worldwide from 2020 to 2025, giving renal care a solid base to build on.
- More patient opportunities exist in the next four biggest markets than in China and India together.
- The merger of Fresenius Medical Care and DaVita's patient population generates a strong and sustained demand for dialysis products.
- Fresenius Medical Care and DaVita have treatment center footprints of 3,700 and 3,000, respectively, compared to the rest of the competitors.
- With a larger R&D investment than Fresenius Medical Care, despite its smaller dialysis network, Asahi Kasei's large investment is indicative of its strong
- innovation capabilities.
Market Overview
According to the blood filtration and purification market estimate, the market is expected to reach USD 4.29 billion by 2026 with an expected CAGR of 7.95% till 2035. The rising chronic kidney disease (CKD) population, an increasing number of treatments, and ongoing market investment in blood purification technologies among top renal care and medical technology companies back market demand.
Rising usage of sophisticated filtration and purification equipment in hospitals and specialized therapeutic institutes is also helping the market. Also, the market is being supported by the increased penetration of advanced filtration and purification technologies in healthcare settings, such as hospitals and specialized therapeutic centers. Developments in membranes, adsorption systems, and extracorporeal platforms may improve treatment performance and expand the range of clinical applications. Healthcare expenditure and the need to manage complex blood-related conditions may influence demand for relevant filtration and purification technologies.
How Has the Global Chronic Kidney Disease Patient Pool Increased?
| Year | Patients |
| 2020 | 62,00,00,000 |
| 2021 | 63,50,00,000 |
| 2022 | 64,80,00,000 |
| 2023 | 66,00,00,000 |
| 2024 | 67,00,00,000 |
| 2025 | 67,40,00,000 |
Aman believes that the population of chronic kidney disease (CKD) patients has been steadily increasing from 620 million in 2020 to 674 million in 2025, gaining nearly 54 million patients in the last five years. The steady rise is due to diabetes, hypertension, and age-related diseases becoming more common globally. The patient population has increased at a steady rate, instead of experiencing sudden peaks or troughs, indicating the chronic and ongoing burden of disease. This predictability helps make CKD one of the more accurate measures of future health care needs.
The increasing patient population is the base demand for the blood filtration and purification market. Patient growth is a direct contributor to market growth, as all blood purification and dialysis treatments will ultimately help improve patients' lives and will be connected to patients with CKD.
Key Insight: The chronic kidney disease patient pool grew from 620 million to 674 million between 2020 and 2025, a steady, unsparing 54 million patient increase that anchors demand for the rest of this market.
Source: Precedence Research Database
Which Countries Have the Largest Blood Purification Patient Opportunity?
| Country | Patients |
| United States | 3,70,00,000 |
| China | 13,20,00,000 |
| India | 10,10,00,000 |
| Japan | 1,30,00,000 |
| Germany | 85,00,000 |
| Brazil | 1,80,00,000 |
Based on the population size, there are around 132 million and 101 million patients with chronic kidney disease (CKD) in China and India, respectively, representing the largest patient opportunity pools. They are also extremely populous and have higher rates of diabetes and hypertension, which makes for significantly larger CKD markets than most other countries. The U.S. has about 37 million patients, followed by Brazil, Japan, and Germany, which have about 18 million, 13 million, and 8.5 million patients, respectively.
The distance between China/India and the next tier of markets is very big, indicating the distinctiveness of the volume of demand in these two countries. In total, they constitute a disproportionately high percentage of the global CKD patient base. Thus important growth markets for providers and medical device manufacturers.
Key insight: Both countries have a strategic tier of their own, with China having 132 million patients and India 101 million, compared to the next four countries combined, which have 104 million.
Source: Precedence Research Database
How Many Patients Are Treated Through Major Dialysis Networks?
| Company | Patients |
| Fresenius Medical Care | 3,32,000 |
| DaVita | 2,81,000 |
| Baxter | 1,80,000 |
| B. Braun | 1,20,000 |
| Nipro | 95,000 |
| Asahi Kasei | 80,000 |
Fresenius Medical Care treats the largest disclosed patient base at 332,000, followed by DaVita at 281,000, Baxter at 180,000, B. Braun at 120,000, Nipro at 95,000, and Asahi Kasei at 80,000. Fresenius and DaVita combined treat more than 600,000 patients, which is more than half of the dialysis network business and more than most rivals. They point to the extent to which companies have gravitated toward these two. That scale advantage is the source of the cash flow that keeps rolling down through the rest of this market as recurring consumables, dialyzers, filters, and blood purification products.
Key Insight: Fresenius Medical Care and DaVita hold more than 600,000 patients between them, a focus that makes the demand for the consumables the company treats much harder to beat repeatedly.
Source: Precedence Research Database
How Many Treatment Locations Support Major Blood Purification Providers?
| Company | Locations |
| Fresenius Medical Care | 3,700 |
| DaVita | 3,000 |
| B. Braun | 360 |
| Baxter | 290 |
| Nipro | 250 |
| Asahi Kasei | 200 |
DaVita has 3,000 treatment centers, followed by Fresenius Medical Care with 3,700. B. Braun is followed by Baxter with 290 sites, Nipro with 250 sites, and Asahi Kasei with 200 sites. The difference between the top two companies and the rest is also huge in Fresenius's case, ten times higher than B. Braun's footprint, following the same trend as in the patient-treatment figures above. Route density is a key factor over and above the simple scale because those who require dialysis will frequently make three trips per week, making physical location count relevant.
Key Insight: Fresenius Medical Care's 3,700 locations and DaVita's 3,000 dwarf the rest of the field, mirroring the same patient-concentration pattern seen in treatment volume and reinforcing how consolidated this industry's physical infrastructure has become.
Source: Precedence Research Database
How Has Blood Purification Treatment Demand Expanded?
| Year | Treatment Events |
| 2025 | 45,00,00,000 |
| 2027 | 49,20,00,000 |
| 2029 | 54,00,00,000 |
| 2031 | 60,10,00,000 |
| 2033 | 66,20,00,000 |
| 2035 | 71,90,00,000 |
Treatment events are projected to climb from 450 million in 2025 to 719 million by 2035. The 60% forecast increase in total procedure volume over the decade stems from an increase in the proportion of patients with chronic disease conditions and greater availability of treatment, resulting in increased access for patients who were undiagnosed or undertreated. Treatment-event estimates can help indicate potential demand for related products, although actual consumption depends on treatment protocols and product utilization.
Key Insight: The number of treatment events increases from 450 million to 719 million in the years 2025 to 2035, which is approximately a 60% growth in procedure numbers and nearly directly proportional to the growth in consumable demand throughout the industry.
Source: Precedence Research Database
What Is the Revenue Scale of Leading Blood Purification Companies?
| Company | Revenue (USD Million) |
| Fresenius Medical Care | 19,300 |
| DaVita | 12,600 |
| Baxter | 10,800 |
| B. Braun | 9,100 |
| Nipro | 4,700 |
| Asahi Kasei | 18,600 |
Asahi Kasei reported USD 18.6 billion, just behind Fresenius Medical Care with around USD 19.3 billion in revenues. The comparison is special as the two companies have completely different business models. Fresenius is highly specialized in dialysis services. While the revenue of Asahi Kasei comes from a much wider spectrum of activities, like chemicals, materials, healthcare, and industrial businesses. This all may seem like a lot of differences; both companies occupy closely matched positions on the revenue list, which indicates their large size and international presence.
DaVita (USD 12.6 billion), Baxter (USD 10.8 billion), B. Braun (USD 9.1 billion), and Nipro (USD 4.7 billion) are in the next level. The two market leaders continue to dominate the blood purification and renal care market, but there is a significant revenue difference between these companies and the two big ones. Asahi Kasei, in particular, deserves special attention as the company has a more diversified business mix than Fresenius, but a revenue base of a similar size. This financial strength gives the company greater resources to invest in, innovate, and expand its operations. Potentially making it a significant force in shaping the future of the blood purification market.
Key Insight: Fresenius Medical Care's USD 19.3 billion narrowly leads Asahi Kasei's USD 18.6 billion, a striking result given Asahi Kasei's business extends well beyond blood purification into broader industrial chemicals and materials.
Source: Precedence Research Database
How Many Blood Purification Products Do Leading Companies Offer?
| Company | Products |
| Fresenius Medical Care | 95 |
| Baxter | 82 |
| B. Braun | 76 |
| Nipro | 68 |
| Asahi Kasei | 61 |
| Toray | 54 |
The largest listed portfolio would be that of Fresenius Medical Care, with 95 products, disclosing the widest range of pharmaceuticals, followed by Baxter with 82, B. Braun with 76, Nipro with 68, Asahi Kasei with 61, and Toray with 54. Portfolio breadth aligns reasonably well with revenue/patient-scale reported in previous sections, and illustrates that the biggest players in this market are not specialists. Their portfolios cover multiple product categories within the market. They offer more equipment with the ability to add consumables to these contracts, giving the companies a larger equipment catalog and over time creating stronger customer relationships.
Key Insight: Fresenius Medical Care has 95 products in its portfolio, and product breadth closely mirrors revenue and patient-scale positions indicated above. This makes scale the common denominator across all of these metrics for comparing positions.
Source: Precedence Research Database
How Are Major Blood Purification Companies Distributed Globally?
| Region | Companies |
| North America | 11 |
| Europe | 14 |
| Asia Pacific | 16 |
| Latin America | 5 |
| Middle East and Africa | 4 |
| Other Markets | 6 |
The top 16 blood purification companies in the market are based in Asia Pacific, followed by Europe with 14, and North America with 11 companies. There are 6 companies that specialize in other markets, 5 in Latin America, and 4 in the Middle East and Africa. But that matches the patient-population data mentioned above, as the distribution of the company concentration in the Asia Pacific region is roughly in line with it, as some of China and India's vast patient population is already pointing to the industry's manufacturing and R&D focus.
Key Insight: The 16-company concentration in Asia Pacific compares well to the tremendous concentration of patients in the region, as detailed above in this study.
Source: Precedence Research Database
Which Leading Companies are Investing in Blood Purification Innovation?
| Company | R&D Investment (USD Million) |
| Fresenius Medical Care | 450 |
| Baxter | 390 |
| B. Braun | 350 |
| Nipro | 210 |
| Asahi Kasei | 580 |
| Toray | 410 |
Aman interpreted that Asahi Kasei has disclosed an R&D expenditure of USD 580 million, followed by Fresenius Medical Care with an R&D expenditure of USD 450 million, and Toray with an R&D expenditure of USD 410 million. On the other hand, Baxter has an R&D expenditure of USD 390 million, B. Braun has an R&D expenditure of USD 350 million, and Nipro has an R&D expenditure of USD 210 million. It looks like this is the case with Asahi Kasei, trailing Fresenius in terms of the share of company scale. But appearing at the top of the list for reliance on membranes and adsorption as its means of differentiation, rather than its patient network and geography.
Key Insight: Asahi Kasei's R&D budget of USD 580 million, also smaller than that of Fresenius Medical Care's 450 million USD, indicates a higher R&D investment as part of the company's portfolio than a firm with a larger network of treatment locations to protect against drug failures.
Source: Precedence Research Database
How Could the Blood Purification Addressable Patient Base Grow Through 2035?
| Year | Addressable Patients |
| 2025 | 67,40,00,000 |
| 2027 | 70,30,00,000 |
| 2029 | 73,50,00,000 |
| 2031 | 76,80,00,000 |
| 2033 | 80,30,00,000 |
| 2035 | 84,00,00,000 |
The addressable patient base is projected to expand from 674 million in 2025 to 840 million by 2035, moving through 703 million in 2027, 735 million in 2029, 768 million in 2031, and 803 million in 2033. That's an increase of 166 million potential patients in the decade, which is supported by population aging and rising levels of chronic disease across the board, and growing access to healthcare reaching people in markets. There may not have been a strong expectation that a diagnostic room or treatment center was there. This curve is really the upper limit of the size of a market's underlying demand, no bigger than what can be reasonably achieved.
Key Insight: From the outset, the size of the underlying demand for this market is capped at 840 million. At the beginning, the maximum number of addresses is set at 840 million as opposed to 674 million, while the patient base will grow from 2026 to 2035.
Source: Precedence Research Database
Segmentation Analysis
Product Insights
Despite this being the category with the highest market share at 34.20%, filtration kits and reagents will still finish 2035 with a market share of 31.80%. This will grow at a 7.20% CAGR, the lowest of the four product areas mentioned in the table, due to growth across all other product areas.
Sample preparation systems' market share is 23.65% to 23.10% with a CAGR of 7.75%, while that of the smallest of the categories. Specialty assays and columns decrease from 14.30% to 11.50% market share at a CAGR of 5.95%. Membrane, filters, and consumables are the fastest-growing segment in the market, growing year-on-year from 27.85% to 33.60% at a 9.60% CAGR, a rate that lines up closely with the rising treatment-event volume covered earlier, since every additional dialysis session directly consumes another filter or membrane.
Key Insight: By 2035, membrane, filter, and consumables will be the largest product segment with the highest growth rate at 9.60%, growing at almost the same pace as treatment volume is growing, directly proportional to growth in treatment volume.
Source: Precedence Research Database
Application Insights
Infectious disease diagnostics is the biggest application area in 2026 with 29.75% of market share and is forecast to grow at 7.10% CAGR from 2026 to 27.10% by 2035. Toxicology and immunodiagnostics dominate the market with a 19.60% share, to ease to 18.75% with 7.45% CAGR, while therapeutic blood purification dominates the market with a share of 11.35% to ease to 10.95% with 7.55% CAGR.
The other applications also lag, with the slowest growth punch at 4.85% CAGR, declining from 6.55% to 4.65% share of the market. On the other hand, cancer diagnostics grows in terms of market share from 16.80% to 18.10%, at 8.75% CAGR. Genetic and molecular diagnostics witness the highest growth of all applications at 10.10% CAGR. This category is shifting from a niche diagnostic area to one that's replacing specialty diagnostics as its own mainstay, which is expected to happen.
Key Insight: Genetic and molecular diagnostics grows fastest of any application at a 10.10% CAGR, climbing to 20.45% market share, on track to overtake several larger categories as it moves from niche use into mainstream diagnostics.
Source: Precedence Research Database
End User Insights
In 2026, clinical diagnostic laboratories are the leading end-user segment at a 43.80% share, further expected to grow at the slowest rate of 7.25%, settling at 40.60% by 2035 but retaining its lead position throughout the forecast period. Research and academic institutes have gained market share from 14.85% to 15.80% with an 8.60% CAGR.
Blood banks and transfusion centers increased at an 8.30% CAGR to grow from 8.25% to 8.60% market share. On the other hand, other end users increased steadily from 5.65% to 5.85% with an 8.25% CAGR. Hospitals are among the larger segments that grew at an average CAGR of 8.55% between 2013 and 2018, gaining a green footpath to the point of care and outshining standalone labs and purification facilities.
Key Insight: Larger end-user categories purify at the highest rate (8.55% CAGR), accruing the most share as purification and diagnostic work moves closer to the edge of the bed and out of the lab.
Source: Precedence Research Database
Region Insights
The largest market in 2026 is North America at 41.30% market share, which slows to 37.20% in 2035 at a 6.75% CAGR. The lowest among all regions, whereas the smallest market is the Middle East at 41.05% in 2035 (5.63% CAGR). The 7.10% CAGR figure for Europe eases the market share from 25.85% to 23.90%, with the smallest region falling from 4.45% to 3.80% market share at a CAGR of 6.45%.
The Asia Pacific region is the clear leading growth region, with market share rising from 22.95% to 29.85%, and growing at a 10.15% CAGR, the fastest of all regions. Due to the large patient populations of China and India and the dense concentration of companies in the region, as discussed previously in this analysis.
Key Insight: Asia Pacific is the fastest-growing region at 10.15% CAGR and will be outstripping North America soon at 29.85% of the market share, right as China and India are having exceptional patient numbers.
Source: Precedence Research Database
Expert Insights
The development of more targeted and purification therapies is advancing from conventional extracorporeal to more clinical approaches. I believe that there are interesting applications of the interface between new and improved filtration technologies, at the level of selective blood purification, and also the increasingly complex platforms of extracorporeal treatment. Rather than just filtering, the market is evolving to be able to remove specific toxins, inflammatory mediators, pathogens, and other harmful substances from the blood. The rising incidence of serious diseases like kidney disease, sepsis, and blood malignancies will drive demand for effective blood cleaning systems in the coming decade.
Our Experts
Deepa Pandey performed the key market research from which the report's analytical foundations were built, helped establish the methodology, and analyzed the market segmentation, regional trends, competitive dynamics, and outlook.
It was Aman who gathered and verified regulatory filings, other industry-bound financial records, product data from companies, pricing data, and other quantitative data from various sources, which included information that is not dependent on the companies, to build the evidence base supporting the market estimation substantially.
Aditi validated and finalized the report, making sure that it is accurate, consistent, and detailed; performed complete research, quality checks, and validation on the research document; and fine-tuned the research content and corrected inconsistencies.
Blood Filtration and Purification Market Segmentation
By Product
- Filtration Kits & Reagents
- Membranes, Filters & Consumables
- Sample Preparation Systems
- Specialty Assays & Columns
By Application
- Infectious Disease Diagnostics
- Toxicology & Immunodiagnostics
- Cancer Diagnostics
- Genetic & Molecular Diagnostics
- Therapeutic Blood Purification
- Other Applications
By End User
- Clinical Diagnostic Laboratories
- Hospitals
- Research & Academic Institutes
- Blood Banks & Transfusion Centers
- Other End Users
By Region
- North America
- Europe
- Asia Pacific
- Latin America
- Middle East & Africa
Questions This Report Deliberately Leaves Open
- What will be the blood filtration and purification market in the world in 2030 and 2035??
- How should the global CKD patient pool (674 million in 2025) be reconciled against the addressable patient base (also 674 million in 2025, projected to reach 840 million by 2035)? Are these the same population or different definitions?
- Why does China's patient opportunity (132 million) so substantially exceed India's (101 million) despite India's faster-growing broader healthcare market?
- How concentrated is dialysis-network patient volume among Fresenius Medical Care (332,000 patients, 3,700 locations) relative to the rest of the disclosed competitive set?
- What is the implication of Asahi Kasei's USD 18,600 million revenue and USD 580 million investment in R&D for blood filtration and purification on competitiveness?
- Why are Membranes, Filters & Consumables expected to grow faster than the currently larger Filtration Kits & Reagents segment?
- What does the 10.10% CAGR of Genetic & Molecular Diagnostics indicate about the changing role of blood filtration and purification technologies across diagnostic applications?
- What are the implications if there are a greater number of events in 2035, at 719 million, than the number in 2025, at 450 million, for the future of filters, membranes, kits, and other consumables?
- What is the best strategy for smaller players, like Nipro or Toray, to stand up against the larger players with their greater revenue streams, product offerings, and R&D budgets?
- In the Asia Pacific region, the market is projected to grow at the highest rate, 10.15% CAGR, or is the market in North America, having the largest market share at 41.30%, more suitable for investment?
- How does the regional company distribution (16 companies in Asia Pacific vs. 14 in Europe vs. 11 in North America) compare to where actual market revenue is concentrated today?
- What is the likely timeline for Hospitals, growing at an 8.55% CAGR, to close the gap with Clinical Diagnostic Laboratories, the largest end-user segment?
- How should companies balance product-portfolio breadth against R&D intensity when assessing their ability to compete and innovate in the blood filtration and purification market?
- What role will Therapeutic Blood Purification play in future market growth compared with the broader diagnostics-focused applications?
- How sensitive is the addressable patient growth outlook to improvements in healthcare access, diagnosis rates, and treatment availability across large-population markets such as China and India?
References
- Precedence Research Database
"Blood Filtration and Purification Market - Patient Population, Company Landscape, and Segmentation Data"
Data used: Market size, CAGR, all patient-population and treatment-demand tables, all company revenue/scale/R&D tables, and all segment share/CAGR tables presented throughout this report.
For inquiries regarding discounts, bulk purchases, or customization requests, please contact us at sales@precedenceresearch.com
Frequently Asked Questions





Ask For Sample
No cookie-cutter, only authentic analysis – take the 1st step to become a Precedence Research client
 Get a Sample
.webp)



 sales@precedenceresearch.com
 Schedule a Meeting