Europe Pharmacovigilance Market Size is USD 2.4 Billion in 2026
Europe Pharmacovigilance Market (By Product Life Cycle (Pre-clinical, Phase I, Phase II, Phase III, Phase IV); By Service Provider (In-house, Contract Outsourcing); By Type (Spontaneous Reporting, Intensified ADR Reporting, Targeted Spontaneous Reporting, Cohort Event Monitoring, EHR Mining); By End Use (Pharmaceuticals, Biotechnology Companies, Medical Device Manufacturers, Others); By Therapeutic Area (Oncology, Neurology, Cardiology, Respiratory Systems, Others); By Process Flow (Case Data Management, Signal Detection, Risk Management System)) Industry Size, Share, Growth, Trends 2026 to 2035.


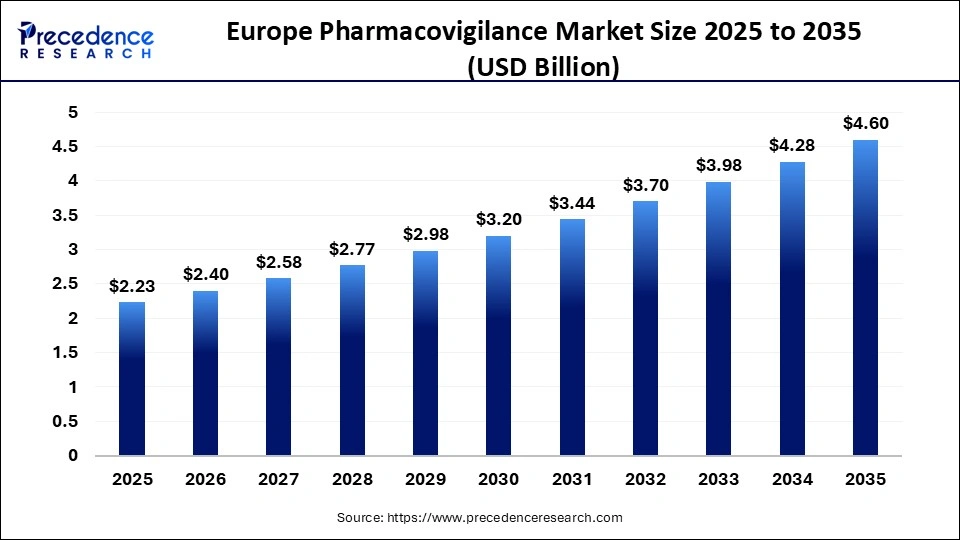
The Europe pharmacovigilance market size was estimated at USD 2.23 billion in 2025 and is expanding at a CAGR of 7.50% from 2026 to 2035. The rising number of clinical trials and new drug development are driving the market.
Europe Seasoning Market Statical Scope
| Reports Attributes | Statistics |
| Market Size in 2025 | USD 2.23 Billion |
| Market Size in 2026 | USD 2.4 Billion |
| Market Size by 2035 | USD 4.6 Billion |
| CAGR 2026 to 2035 | 7.5% |
| Base Year | 2025 |
| Forecast Period | 2026 to 2035 |
The Europ pharmacovigilance market is a vital component of the continent's healthcare and pharmaceutical ecosystem, ensuring the safety, efficacy, and quality of drugs throughout their life cycles. Pharmacovigilance, often referred to as drug safety surveillance, involves the detection, assessment, understanding, and prevention of adverse effects or other drug-related issues.
Europe is a favorable location for conducting Phase I clinical trials due to its large foreign population, highly qualified workforce, superior service quality, and well-developed infrastructure capable of handling multi-country clinical trials. Furthermore, the European Medicines Agency (EMA) has established the Risk Management Plan (RMP) to govern the pharmacovigilance system.
Countries in Europe, particularly Germany, the UK, France, and Italy, are investing in advanced pharmacovigilance platforms integrated with real-time signal detection, AI-based adverse event prediction, and automated case processing tools.
Europe Pharmacovigilance Market Share, By Country, 2025
- Germany- The rising incidence of adverse drug reactions, driven by drug abuse and the prevalence of diseases requiring a combination of medications, are major factors contributing to overall market growth in Germany. Additionally, an increase in the production of new drugs and a stringent regulatory framework for drug safety further support the significant expansion of this market.
Europe Pharmacovigilance Market Share, By Product Lifecycle, 2025, (%)
| Segments | Shares (%) |
| Phase IV | 40% |
| Phase III | 27% |
| Phase II | 15% |
| Phase I | 10% |
| Pre-clinical | 8% |
- Phase IV- The pharmacovigilance market is largely driven by Phase IV activities with a share of 40%, as post-marketing surveillance generates continuous real-world safety data.
- Phase III- this segment mainly focuses on pre-commercialization efficacy data and holds 27% share.
- Phase II- rising importance of creating real-world evidence to optimize drug use increases the phase II trial with 15% share.
- Phase I- growing need for early safety monitoring contributes to segment growth and holds 10% share.
Europe Pharmacovigilance Market Share, By Type, 2025, (%)
| Segments | Shares (%) |
| Spontaneous Reporting | 32% |
| EHR Mining | 20% |
| Cohort Event Monitoring | 18% |
| Targeted Spontaneous Reporting | 16% |
| Intensified ADR Reporting | 14% |
- Spontaneous reporting - Spontaneous reporting dominates with a share of 32%, as it remains the preliminary method for the collection of adverse drug reactions.
- EHR mining- EHR mining holds a share of 20%, supported by increasing digital healthcare adoption and demand for real-world evidence.
- Cohort event monitoring- Cohort event monitoring accounts for a share of 18%, used in structured post-marketing surveillance due to its proactive nature in tracking drug and vaccine safety.
- Targeted spontaneous reporting- Targeted spontaneous reporting represents a share of 16%, due to demand for more precise and comprehensive information on adverse drug reactions.
Europe Pharmacovigilance Market Share, By End Use, 2025, (%)
| Segments | Shares (%) |
| Pharmaceuticals | 48% |
| Biotechnology Companies | 22% |
| Medical Device Manufacturers | 18% |
| Others | 12% |
- Pharmaceuticals- Pharmaceutical companies dominate with a share of 48%, because of strict regulatory compliance requirements with an extensive drug portfolio.
- Biotechnology companies- Biotechnology companies hold a share of 22%, due to growing investment in the biotechnology firms.
- Medical device manufacturers- Medical device manufacturers account for a share of 18%, due to the European Medical Devices Regulation (MDR) and the need for post-marketing surveillance.
Europe Pharmacovigilance Market Share, By Therapeutic Area, 2025, (%)
| Segments | Shares (%) |
| Oncology | 30% |
| Neurology | 20% |
| Cardiology | 18% |
| Respiratory Systems | 17% |
| Other | 15% |
- Oncology- Oncology dominates with a share of 30%, due to high-risk cancer therapy monitoring and high cancer drug approvals.
- Neurology- Neurology holds a share of 20%, due to the increasing prevalence of Alzheimer's, Parkinson's, and multiple sclerosis.
- Cardiology- Cardiology accounts for a share of 18%, due to swift development of new cardiac drugs and medical devices.
- Respiratory systems- Respiratory systems represent a share of 17%, due to rising prevalence of chronic respiratory disorders.
Top Companies in Europe Pharmacovigilance Market
- ICON PLC.
- CAPGEMINI
- Arithmos
- QbD Group
- LINK Medical
- ANP Pharma
- Bayer AG
- AstraZeneca
- Mirpharm Group of Pharmaceutical Companies
- Congenix
Segments Covered in the Report
By Product Life Cycle
- Pre-clinical
- Phase I
- Phase II
- Phase III
- Phase IV
By Service Provider
- In-house
- Contract Outsourcing
By Type
- Spontaneous Reporting
- Intensified ADR Reporting
- Targeted Spontaneous Reporting
- Cohort Event Monitoring
- EHR Mining
By End Use
- Pharmaceuticals
- Biotechnology Companies
- Medical Device Manufacturers
- Others
By Therapeutic Area
- Oncology
- Neurology
- Cardiology
- Respiratory Systems
- Other
By Process Flow
- Case Data Management
- Signal Detection
- Risk Management System
| Therapeutic Area | 2025 | 2026 | 2027 | 2028 | 2029 | 2030 | 2031 | 2032 | 2033 | 2034 | 2035 |
|---|---|---|---|---|---|---|---|---|---|---|---|
| Oncology | 0.78 | 0.84 | 0.90 | 0.97 | 1.04 | 1.12 | 1.20 | 1.29 | 1.39 | 1.50 | 1.61 |
| Neurology | 0.49 | 0.53 | 0.57 | 0.61 | 0.65 | 0.70 | 0.76 | 0.81 | 0.87 | 0.94 | 1.01 |
| Cardiology | 0.37 | 0.40 | 0.43 | 0.46 | 0.49 | 0.53 | 0.57 | 0.61 | 0.66 | 0.71 | 0.76 |
| Respiratory | 0.28 | 0.30 | 0.32 | 0.35 | 0.37 | 0.40 | 0.43 | 0.46 | 0.50 | 0.54 | 0.58 |
| Other | 0.31 | 0.33 | 0.36 | 0.39 | 0.41 | 0.45 | 0.48 | 0.51 | 0.55 | 0.59 | 0.64 |
| Process Flow | 2025 | 2026 | 2027 | 2028 | 2029 | 2030 | 2031 | 2032 | 2033 | 2034 | 2035 |
|---|---|---|---|---|---|---|---|---|---|---|---|
| Case Data Management | 0.99 | 1.06 | 1.14 | 1.23 | 1.32 | 1.42 | 1.53 | 1.64 | 1.77 | 1.90 | 2.04 |
| Signal Detection | 0.80 | 0.86 | 0.92 | 0.99 | 1.07 | 1.15 | 1.23 | 1.33 | 1.43 | 1.53 | 1.65 |
| Risk Management System | 0.44 | 0.47 | 0.51 | 0.55 | 0.59 | 0.63 | 0.68 | 0.73 | 0.78 | 0.84 | 0.91 |
Research Methodology
Related Databooks
March 2026
March 2026
March 2026
March 2026

 sales@precedenceresearch.com
 +1 804-441-9344
 Download Databook
 Schedule a Meeting