Middle East Nanocatalysts Market Size is USD 69.32 million in 2026
Middle East Nanocatalysts Market (By Material: Metal-based Nanocatalysts, Metal Oxide Nanocatalysts, Carbon-based Nanocatalysts, Polymeric Nanocatalysts, Composite Nanocatalysts; By Application: Petroleum Refining, Chemicals, Environmental, Energy & Fuel Cells, Automotive, Electronics & Semiconductor, Food & Beverage, Pharmaceuticals & Biotechnology) Industry Size, Share, Growth, Trends 2026 to 2035.


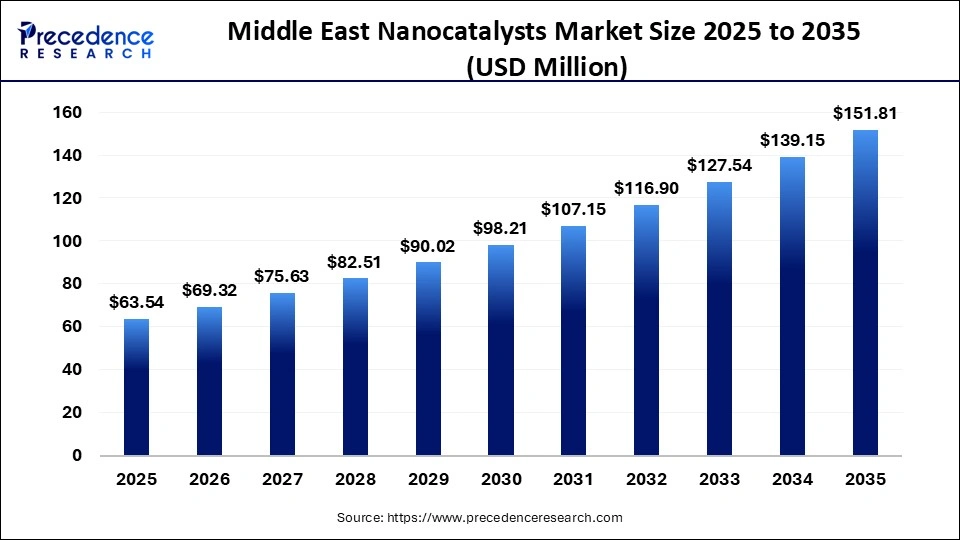
The Middle East nanocatalysts market size was estimated at USD 63.54 million in 2025 and is expanding at a CAGR of 9.1% from 2026 to 2035. Due to rising investments in refinery modernization and clean energy technologies, strong demand for efficient catalytic processes, petrochemical and hydrogen production, and supportive government sustainability initiatives.
Middle East Nanocatalysts Market Statical Scope
| Reports Attributes | Statistics |
| Market Size in 2025 | USD 63.54 Million |
| Market Size in 2026 | USD 69.32 Million |
| Market Size by 2035 | USD 151.81 Million |
| CAGR 2026 to 2035 | 9.10% |
| Base Year | 2025 |
| Forecast Period | 2026 to 2035 |
In the Middle East Nano-Catalyst market, technological progress is centered on developing catalysts with enhanced activity selectivity and durability that perform effectively under extreme industrial conditions. Innovations include advanced nanostructured materials that boost reaction rates and reduce energy needs in refining and petrochemical , alongside next-generation catalysts for hydrogen production and emissions. These improvements are supported by increased R and D investments and regional focus on cleaner, more efficient processes across energy and environmental sectors.
Middle East Nanocatalysts Market Share, By Country, 2025 (%)
- UAE- Because it's gaining traction as industries seek more efficient and cleaner catalytic solutions, especially in petroleum refining, petrochemicals, and environmental sectors, driven by sustainability and technological innovation, and strategic investment in advanced materials. The UAE's robust industrial infrastructure supports the rising adoption of nano-catalysts. To improve process efficiency and reduce emissions, the market is also propelled by government initiatives promoting clean energy and innovation ecosystems.
- Saudi Arabia- Because the petrochemicals, refining, and energy sectors, its strong oil and gas infrastructure, and push towards cleaner hydrogen and advanced industrial processes help boost demand for efficient nano-catalysts, Strategic investments in R & D sustainability goals under economic diversification plans to support market growth.
Middle East Nanocatalysts Market Share, By Material, 2025 (%)
| Segments | Shares (%) |
| Metal-Based Nanocatalysts | 38% |
| Metal-Oxide Nanocatalysts | 24% |
| Carbon-Based Nanocatalysts | 17% |
| Polymeric Nanocatalysts | 11% |
| Composite Nanocatalysts | 10% |
- Metal-Based Nanocatalysts- The segment dominated the market with a 38% share, due to its superior catalytic performance, versatility in petrochemical and energy applications, and strong demand for efficient industrial processes.
- Metal-Oxide Nanocatalysts- The segment accounted for 24% of the total market share, due to its high stability, excellent catalytic efficiency, and wide industrial applications in refining petrochemicals and environmental processes.
- Carbon-Based Nanocatalysts- The segment accounted for 17% of the total market share, due to its high surface area, excellent conductivity, and effectiveness in energy, environmental, and chemical processing applications.
- Polymeric Nanocatalysts- The segment accounted for 11.0% of the total market share, due to its customization structures, cost-effectiveness, and growing use in chemical synthesis, pharmaceutical , and environmentally friendly industrial processes. Composite
- Composite Nanocatalysts- The segment accounted for 10% of the total market share, due to its enhanced stability, synergistic performance, and versatility in refining petrochemicals and environmental applications, making them attractive for advanced industrial processes.
Middle East Nano Catalysts Market Share, By Application, 2025 (%)
| Segments | Shares (%) |
| Petroleum Refining | 32% |
| Chemicals | 18% |
| Energy & Fuel Cells | 12% |
| Environmental | 11% |
| Electronics & Semiconductor | 9% |
| Automotive | 8% |
| Pharmaceuticals & Biotechnology | 6% |
| Food & Beverage | 4% |
- Petroleum Refining- The segment dominated the market with a 32% share, due to high demand for efficient refining, enhanced fuel production, and the region's strong oil and gas industry infrastructure.
- Chemicals- The segment accounted for 18% of the total market share, due to increasing demand for efficient chemical synthesis, improved reaction rates, and adoption of advanced catalysts for industrial chemical processes.
- Environmental- The segment accounted for 11% of the total market share, due to a growing focus on pollution control, wastewater treatment, and emission reduction, driving adoption of advanced catalysts for sustainable industrial practices.
- Energy & Fuel Cells- The segment accounted for 12.0% of the total market share, due to rising demand for clean energy, hydrogen production, and efficient fuel cell technologies in recent renewable energy initiatives.
- Automotive- The segment accounted for 8% of the total market share, due to increasing use of emission control, fuel efficiency enhancement, and growing adoption of advanced catalytic technologies in vehicles.
- Electronics & Semiconductor- The segment accounted for 9% of the total market share, due to rising demand for miniaturized high-performance components and advanced nano catalysts enhancing efficiency in semiconductor fabrication and electronic applications.
- Food & Beverage- The segment accounted for 4.% of the total market share, due to growing use of food processing preservation and flavor enhancements, where nano catalysts improve efficiency and product quality.
- Pharmaceuticals & Biotechnology- The segment accounted for 6.00% of the total market share, due to increasing use in drug synthesis, Biocatalysis , an innovative therapy enhancing efficiency, and precision in pharmaceutical manufacturing .
Top Companies in the Middle East Nanocatalysts Market
- Solvay
- Evonik Industries AG
- Clariant
- BASF SE
- AkzoNobel N.V.
- Kemira
- Huntsman International LLC
- DuPont
- LANXESS
- Croda International Plc
- Givaudan
- Novozymes
- DSM
- The Lubrizol Corporation
- Albemarle Corporation
Segments Covered in the Report
By Material
- Metal-based Nanocatalysts
- Metal Oxide Nanocatalysts
- Carbon-based Nanocatalysts
- Polymeric Nanocatalysts
- Composite Nanocatalysts
By Application
- Petroleum Refining
- Chemicals
- Environmental
- Energy & Fuel Cells
- Automotive
- Electronics & Semiconductor
- Food & Beverage
- Pharmaceuticals & Biotechnology
| Material | 2025 | 2026 | 2027 | 2028 | 2029 | 2030 | 2031 | 2032 | 2033 | 2034 | 2035 |
|---|---|---|---|---|---|---|---|---|---|---|---|
| Metal-based | 20.33 | 22.03 | 23.88 | 25.87 | 28.03 | 30.37 | 32.90 | 35.65 | 38.62 | 41.83 | 45.32 |
| Metal Oxide | 15.25 | 16.56 | 17.98 | 19.53 | 21.20 | 23.02 | 25.00 | 27.14 | 29.47 | 32.00 | 34.74 |
| Carbon-based | 10.17 | 11.16 | 12.24 | 13.43 | 14.73 | 16.16 | 17.73 | 19.45 | 21.34 | 23.41 | 25.68 |
| Polymeric | 6.35 | 7.07 | 7.86 | 8.73 | 9.70 | 10.78 | 11.97 | 13.28 | 14.74 | 16.35 | 18.13 |
| Composite | 11.44 | 12.51 | 13.68 | 14.95 | 16.35 | 17.88 | 19.55 | 21.38 | 23.37 | 25.56 | 27.94 |
| Application | 2025 | 2026 | 2027 | 2028 | 2029 | 2030 | 2031 | 2032 | 2033 | 2034 | 2035 |
|---|---|---|---|---|---|---|---|---|---|---|---|
| Petroleum Refining | 17.79 | 19.19 | 20.71 | 22.34 | 24.10 | 26.00 | 28.04 | 30.25 | 32.63 | 35.19 | 37.95 |
| Chemicals | 11.44 | 12.36 | 13.36 | 14.43 | 15.59 | 16.85 | 18.21 | 19.67 | 21.26 | 22.97 | 24.81 |
| Environmental | 6.35 | 6.97 | 7.65 | 8.40 | 9.21 | 10.11 | 11.09 | 12.17 | 13.35 | 14.64 | 16.06 |
| Energy & Fuel Cells | 7.62 | 8.42 | 9.30 | 10.27 | 11.34 | 12.52 | 13.81 | 15.24 | 16.81 | 18.53 | 20.44 |
| Automotive | 5.72 | 6.28 | 6.90 | 7.58 | 8.33 | 9.15 | 10.05 | 11.03 | 12.11 | 13.30 | 14.60 |
| Electronics & Semiconductor | 5.08 | 5.59 | 6.15 | 6.77 | 7.44 | 8.18 | 9.00 | 9.89 | 10.88 | 11.95 | 13.14 |
| Food & Beverage | 3.18 | 3.49 | 3.83 | 4.20 | 4.61 | 5.06 | 5.55 | 6.08 | 6.67 | 7.32 | 8.03 |
| Pharmaceuticals & Biotechnology | 6.35 | 7.01 | 7.73 | 8.52 | 9.39 | 10.35 | 11.41 | 12.57 | 13.84 | 15.24 | 16.79 |
Research Methodology
Related Databooks
March 2026
March 2026
April 2026
April 2026

 sales@precedenceresearch.com
 +1 804-441-9344
 Download Databook
 Schedule a Meeting