


Gas Equipment Market Size, Key Companies, Company Production Capacity, Electricity Generation, Capacity Utilization, Export & Import Analysis, Cost Structure, Competitive Landscape, and Market Outlook
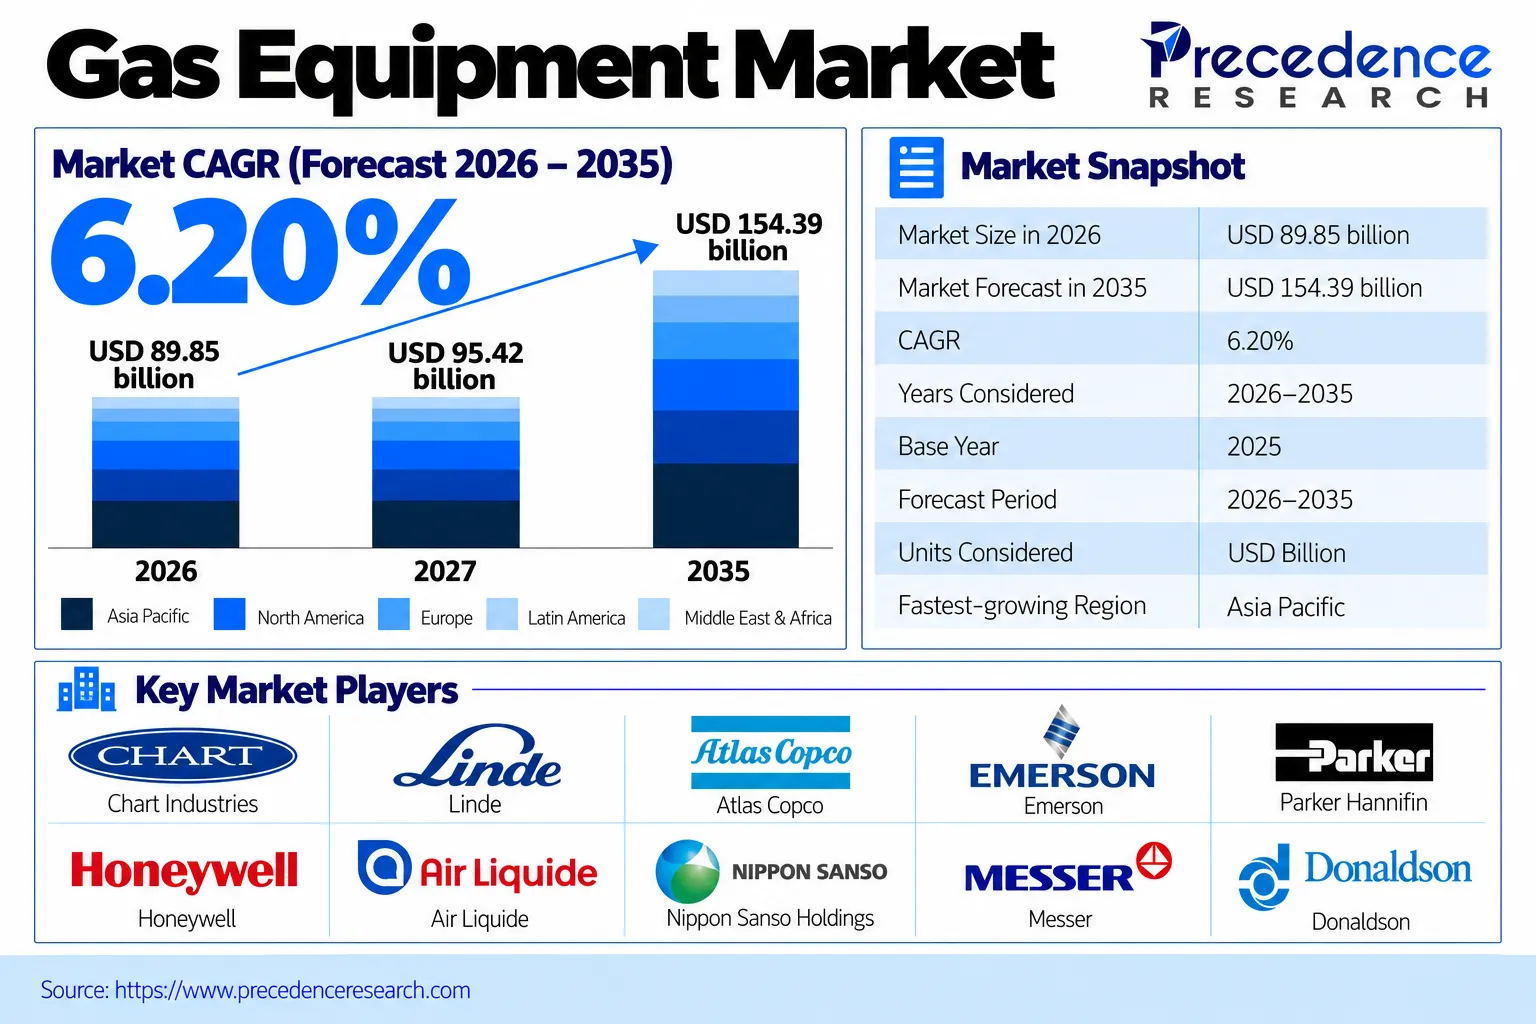
According to energy and power expert Laxmi Narayan, the gas equipment market has reached USD 89.85 billion in 2026 and is expected to grow to USD 154.39 billion by 2035, registering a CAGR of 6.20%. The gas equipment market companies such as Chart Industries, Linde, Atlas Copco, EmAtlas Copcoerson are playing a key role in market expansion, with major opportunities emerging across equipment type, gas type, end user and region segments.
Source: https://www.precedenceresearch.com/gas-equipment-market
 Get a Sample
 Table Of Content


Gas Equipment Market Size, Share and Forecast 2026-2035
The gas equipment market is estimated at USD 89.85 billion in 2026 and is projected to reach USD 154.39 billion by 2035, expanding at a CAGR of 6.20% from 2026 to 2035.
The market was valued at USD 84.60 billion in 2025, the base year. The market encompasses equipment used to generate, store, deliver, control, purify and detect industrial, medical and specialty gases. Gas equipment includes gas delivery systems, cryogenic tanks and vaporizers, regulators, flow devices, on-site gas generators, purifiers and filters, gas detection systems and accessories, valued at factory-gate prices.
 Key Takeaways
Market Size & Growth Outlook
- Market size in 2025: USD 84.60 billion
- Estimated market size in 2026: USD 89.85 billion
- Projected market size by 2035: USD 154.39 billion
- CAGR (2026-2035): 6.20%
Regional Market Spotlight
- North America led the market with a 33.60% (USD 28.43 billion) share in 2025.
- Asia Pacific accounted for 32.80% (USD 27.75 billion) of the market in 2025 and is projected to be the fastest-growing region, at a CAGR of 7.12% from 2025 to 2035.
- Europe accounted for 22.40% (USD 18.95 billion) of the market in 2025.
Segmental Spotlight
- By equipment type, Gas Delivery Systems accounted for 22.40% (USD 18.95 billion) in 2025.
- By gas type, Nitrogen accounted for 24.60% (USD 20.81 billion) in 2025.
- By end user, Metal Fabrication accounted for 24.20% (USD 20.47 billion) in 2025.
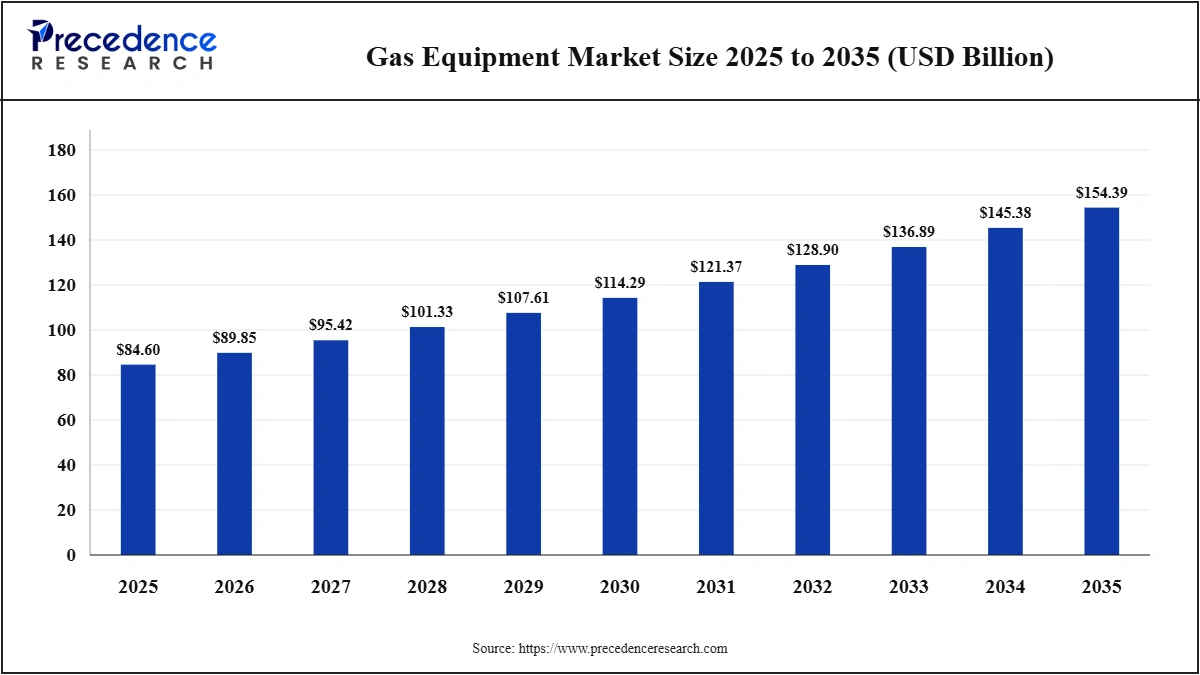
Gas Equipment Market Size and Forecast, 2025-2035 (USD Billion)
Gas delivery systems accounted for the largest equipment share in 2025, at 22.40%, because pipelines, manifolds, and distribution panels are needed wherever gases are used in industry, healthcare, and electronics. North America accounted for 33.60% of revenue in 2025, supported by industrial gas, LNG, and healthcare infrastructure, and a large equipment manufacturing base. Industrial gas use in electronics, metals, and chemicals; hydrogen and LNG projects; the expansion of semiconductor factories that require ultra-high-purity gas systems; and on-site nitrogen and oxygen generation that substitutes transported cylinders are the main demand drivers. Consolidation is transforming the sector through the acquisitions of Chart Industries by Baker Hughes and gas generation companies by Atlas Copco.
Note: 2025 is the base year; 2026-2035 values are forecasts.
Sources: Expert interviews, secondary sources, Precedence Research database and Precedence Research analysts.
The gas equipment market is projected to grow from USD 84.60 billion in 2025 to USD 154.39 billion by 2035 because industrial, healthcare, and electronics users install more gas delivery, control, and generation equipment. Hydrogen and LNG projects need cryogenic and high-pressure systems. The market is expected to reach USD 114.29 billion by 2030 due to the demand for high-value equipment from semiconductor manufacturing and on-site gas generation, with a CAGR of 6.20% from 2026 to 2035.
- Analyst View: We built the estimate from spending on gas handling equipment by end-use industry and gas type, based on industrial gas consumption, new plant and fab construction, LNG and hydrogen projects and replacement of installed equipment, valued at factory-gate prices. Equipment mix reflects delivery systems, cryogenic products, regulators, flow devices, generators, purifiers and detection systems used in each application. The total was cross-checked against the gas equipment revenue of leading equipment makers and industrial gas companies and against published estimates, which places our base year slightly above the comparable figures. The growth rate, which is controlled by industrial cycles, represents consistent industrial demand as well as higher development in semiconductors, hydrogen, LNG, and on-site generation.
Market Trends
- On-site gas generation is replacing delivered cylinders.
- Hydrogen projects need high-pressure and cryogenic equipment.
- Semiconductor fabs require ultra-high-purity gas systems.
- Gas detection is becoming connected and continuous.
- Equipment makers are consolidating through acquisitions.
- LNG and small-scale liquefaction drive cryogenic demand.
Drivers, Restraints and Opportunities
Driver
Industrial gas use in metals, chemicals, food, and electronics keeps growing, and every application needs delivery, control, and safety equipment. Hydrogen, LNG, and carbon capture projects require cryogenic and high-pressure systems. Semiconductor fabs need ultra-high-purity gas handling.
Restraint
Due to lower capital expenditures, industrial recessions result in lower investment in new machinery. Uncertainty results from delayed hydrogen projects. New product development is more expensive and takes longer due to safety regulations and certifications.
Opportunity
Gas generation at a facility can serve as an alternative for cylinder and bulk gas delivery. New equipment will be required for hydrogen refueling, electrolysis, and storage.
Market Segmentation: 2025 Share and Value
Gas Equipment Market by Equipment Type 2025 Share & Size
| Segments | 2025 Share | 2025 Market Value |
| Gas Delivery Systems | 22.40% | USD 18.95 billion |
| Cryogenic Products | 18.60% | USD 15.74 billion |
| Gas Regulators | 12.80% | USD 10.83 billion |
| Gas Generating Systems | 11.20% | USD 9.48 billion |
| Flow Devices | 10.60% | USD 8.97 billion |
| Gas Detection Systems | 9.60% | USD 8.12 billion |
| Purifiers & Filters | 8.40% | USD 7.11 billion |
| Accessories | 6.40% | USD 5.41 billion |
Note: 2025 is the base year.
Sources: Expert interviews, secondary sources, Precedence Research database and Precedence Research analysts.
Gas delivery systems accounted for 22.40% (USD 18.95 billion) in 2025 because manifolds, panels and piping distribute gas to every point of use in factories, hospitals and fabs. Cryogenic products, at 18.60% (USD 15.74 billion), include tanks, vaporizers, and pumps for liquefied gases and LNG. Gas regulators account for 12.80% (USD 10.83 billion) and gas generating systems, at 11.20% (USD 9.48 billion), are the fastest-growing type as users install on-site nitrogen and oxygen generators. Flow devices account for 10.60% (USD 8.97 billion), gas detection systems for 9.60% (USD 8.12 billion), purifiers and filters for 8.40% (USD 7.11 billion) and accessories for 6.40% (USD 5.41 billion).
Gas Equipment Market by Gas Type 2025 Share & Size
| Segments | 2025 Share | 2025 Market Value |
| Nitrogen | 24.60% | USD 20.81 billion |
| Oxygen | 20.80% | USD 17.60 billion |
| Hydrogen | 15.40% | USD 13.03 billion |
| Carbon Dioxide | 10.20% | USD 8.63 billion |
| Helium | 6.80% | USD 5.75 billion |
| Others | 22.20% | USD 18.78 billion |
Note: 2025 is the base year.
Sources: Expert interviews, secondary sources, Precedence Research database and Precedence Research analysts.
Nitrogen accounted for 24.60% (USD 20.81 billion) in 2025, used for inerting, food packaging, laser cutting, and electronics. Oxygen, at 20.80% (USD 17.60 billion), serves steel, healthcare and combustion, and hydrogen, at 15.40% (USD 13.03 billion), is the fastest-growing gas with refining, chemicals and clean energy projects. Carbon dioxide accounts for 10.20% (USD 8.63 billion) and helium for 6.80% (USD 5.75 billion) and other gases, including argon and specialty gases, for 22.20% (USD 18.78 billion).
Gas Equipment Market by End User 2025 Share & Size
| Segments | 2025 Share | 2025 Market Value |
| Metal Fabrication | 24.20% | USD 20.47 billion |
| Chemical | 21.60% | USD 18.27 billion |
| Oil & Gas | 18.40% | USD 15.57 billion |
| Healthcare & Medical | 16.80% | USD 14.21 billion |
| Electronics & Semiconductors | 9.80% | USD 8.29 billion |
| Others | 9.20% | USD 7.78 billion |
Note: 2025 is the base year. Sources: Expert interviews, secondary sources, Precedence Research database and Precedence Research analysts.
Metal fabrication accounted for 24.20% (USD 20.47 billion) in 2025, using gases for cutting, welding and heat treatment. Chemicals, at 21.60% (USD 18.27 billion), and oil and gas, at 18.40% (USD 15.57 billion), use large gas handling and cryogenic systems; healthcare and medical accounts for 16.80% (USD 14.21 billion); electronics and semiconductors, at 9.80% (USD 8.29 billion), are the fastest-growing end user; and other industries account for 9.20% (USD 7.78 billion).
- Analyst View: Segment values were allocated by matching gas consumption and project spending by end user and gas type to equipment categories, using factory-gate prices. Gas delivery systems lead because they are required in almost every installation. We expect gas generating systems, hydrogen equipment, and electronics uses to gain share.
Regional Analysis
Gas Equipment Market by Region 2025 Share & Size
| Region | 2025 Share | 2025 Market Value |
| North America | 33.60% | USD 28.43 billion |
| Asia Pacific | 32.80% | USD 27.75 billion |
| Europe | 22.40% | USD 18.95 billion |
| Middle East & Africa | 6.40% | USD 5.41 billion |
| Latin America | 4.80% | USD 4.06 billion |
Note: 2025 is the base year.
Sources: Expert interviews, secondary sources, Precedence Research database and Precedence Research analysts.
North America accounted for 33.60% (USD 28.43 billion) in 2025, growing on LNG export projects, industrial gas networks, healthcare demand, and new semiconductor fabs. Asia Pacific, at 32.80% (USD 27.75 billion), is the fastest-growing region, supported by manufacturing, electronics, and steel production in China, South Korea, Taiwan, Japan, and India; while Europe, at 22.40% (USD 18.95 billion), grows with hydrogen projects, healthcare, and industrial demand. The Middle East and Africa, at 6.40% (USD 5.41 billion), grows with LNG, hydrogen, and petrochemical projects, and Latin America, at 4.80% (USD 4.06 billion), with mining, metals, and healthcare.
North America accounted for 33.60% (USD 28.43 billion) in 2025. LNG projects, industrial gases, and new fabs drive demand.
Asia Pacific accounted for 32.80% (USD 27.75 billion) in 2025 and is the fastest-growing region. Manufacturing and electronics growth drive demand.
Europe accounted for 22.40% (USD 18.95 billion) in 2025. Hydrogen projects and healthcare boost market growth.
The Middle East and Africa accounted for 6.40% (USD 5.41 billion) in 2025. LNG and hydrogen projects support growth.
Latin America accounted for 4.80% (USD 4.06 billion) in 2025. Mining, metals, and healthcare support demand.
- Analyst View: Regional shares were built from industrial gas consumption, project spending, and equipment replacement in each region, weighted by equipment prices. North America leads because of its LNG, industrial gas, and healthcare spending. The region which is attributed the most growth premium is Asia Pacific since its manufacturing and semiconductors have been growing at the fastest pace.
Top 10 Companies in the Gas Equipment Market
| Rank | Company Name | Market-Specific Revenue (USD Billion) | 2025 Share | Key Products / Business | Headquarters |
| 1 | Chart Industries | 4.3 | 5.08% | Cryogenic tanks, heat exchangers and gas handling equipment | United States |
| 2 | Linde | 3.2 | 3.78% | Gas processing equipment and engineering | Ireland |
| 3 | EmAtlas Cop | 2.8 | 3.31% | Gas generators, compressors and gas handling equipment | Sweden |
| 4 | EmAtlas Copcoerson |
2.6 | 3.07% | Regulators, flow control and gas measurement | United States |
| 5 | Parker Hannifin | 2.4 | 2.84% | Gas regulators, filters and generators | United States |
| 6 | Honeywell | 1.8 | 2.13% | Gas detection and control equipment | United States |
| 7 | Air Liquide | 1.2 | 1.42% | Gas equipment and engineering | France |
| 8 | Nippon Sanso Holdings | 1.1 | 1.30% | Gas equipment and cryogenic products | Japan |
| 9 | Messer | 0.7 | 0.83% | Gas supply and cutting equipment | Germany |
| 10 | Donaldson | 0.6 | 0.71% | Gas filtration and purification | United States |
Note: Company revenues and shares are 2025 estimates.
Sources: Company press releases, expert interviews, secondary sources, Precedence Research database and Precedence Research analysts.
Chart Industries led the gas equipment market with an estimated 5.08% (USD 4.30 billion) of 2025 revenue, followed by Linde at 3.78% (USD 3.20 billion) and Atlas Copco at 3.31% (USD 2.80 billion). Chart Industries, now part of Baker Hughes, leads in cryogenic and gas handling equipment, Linde in gas processing equipment and engineering, and Atlas Copco in on-site gas generation and compression. The top 10 companies accounted for an estimated 24.47% (USD 20.70 billion) of 2025 revenue, while the remaining 75.53% (USD 63.90 billion) was shared among regional regulator, cylinder accessory, and detector and gas generator makers. The gas equipment market is fragmented across many equipment categories, and competition centers on safety, purity, reliability, engineering capability, and service networks, as industrial gas companies, equipment specialists, and conglomerates compete.
Recent Developments
- March 2025: Atlas Copco acquired MSS Nitrogen, a UK and US maker of on-site gas generation systems, gas mixers and filtration for laser cutting.
- July 2026: Baker Hughes completed its acquisition of Chart Industries for USD 13.6 billion, making it a third operating segment covering air and gas handling, thermal management, and life cycle services.
Market Segments
By Equipment Type
- Gas Delivery Systems
- Cryogenic Products
- Gas Regulators
- Gas Generating Systems
- Flow Devices
- Gas Detection Systems
- Purifiers & Filters
- Accessories
By Gas Type
- Nitrogen
- Oxygen
- Hydrogen
- Carbon Dioxide
- Helium
- Others
By End User
- Metal Fabrication
- Chemical
- Oil & Gas
- Healthcare & Medical
- Electronics & Semiconductors
- Others
By Region
- North America (U.S., Canada, Mexico)
- Europe (Germany, U.K., France, Italy, Spain, Rest of Europe)
- Asia Pacific (China, Japan, India, South Korea, Taiwan, Rest of Asia Pacific)
- Latin America (Brazil, Argentina, Rest of Latin America)
- Middle East & Africa (GCC, South Africa, Rest of MEA)
Research Methodology
The gas equipment market was defined as equipment for generating, storing, delivering, controlling, purifying, and detecting industrial, medical, and specialty gases worldwide, valued at factory-gate prices. The 2025 base year was built bottom-up from gas consumption, project spending, and equipment replacement by end user, gas type, and equipment category, and checked top-down against the gas equipment revenue of leading equipment makers and industrial gas companies. Segment, regional, and company values were allocated from equipment types, gases, end users, and regional industrial activity. Key figures used in the calculations have been validated using the comparison between company figures, regulator and industry information, and independent third-party estimates. All segment, regional, and company figures were reconciled to the same 2025 base year, and the 2026-2035 forecast, which applies a constant CAGR from the 2025 base, was recalculated and validated.
Analyst View: Overall Market
The gas equipment market grows with industrial gas use and with new investment in hydrogen, LNG, and semiconductors. Our estimate ties demand to gas use, capital expenditure, and replacement by the end user and equipment. This means that our outlook will follow the industry cycle and energy projects. The positives are tied to power generation, hydrogen and electronics, whereas the negatives are industrial cycles and delayed projects.
Sources and References
- NS Energy. "Baker Hughes wraps up USD 13.6bn Chart Industries acquisition". 2026-07-17. Chart acquisition completion. (Source: https://www.nsenergybusiness.com)
- Atlas Copco. "UK-based manufacturer of gas generation systems has become part of Atlas Copco Group". 2025-03-21. MSS Nitrogen acquisition. (Source: https://www.atlascopcogroup.com)
- Natural Gas World. "Atlas Copco acquires Chinese gas gen equipment maker". 2022-08-05. Suzhou Since Gas System acquisition. (Source: https://naturalgasworld.com)
- Offshore Technology. "Baker Hughes USD 13.6bn Chart Industries acquisition". 2025-07. Chart acquisition announcement. (Source: https://www.offshore-technology.com)
For inquiries regarding discounts, bulk purchases, or customization requests, please contact us at sales@precedenceresearch.com
Frequently Asked Questions





Ask For Sample
No cookie-cutter, only authentic analysis – take the 1st step to become a Precedence Research client
 Get a Sample




 sales@precedenceresearch.com
 Schedule a Meeting