Medical Device Contract Sales Organizations (CSO) Market Size, Share, Segmentation, Companies, and Forecast, 2026-2035
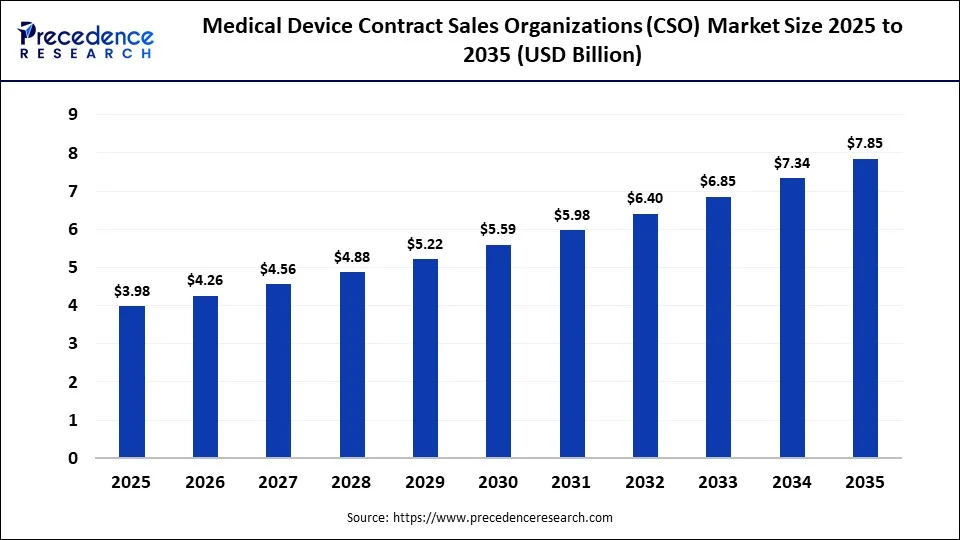
Deepa Pandey is a healthcare market research analyst. She researched the adoption of contract sales forces, outsourced sales arrangements, channel strategies, and factory preferences that are influencing the medical device sales landscape. Her work is useful to medical device manufacturers, contract sales organizations, distributors, and healthcare stakeholders for competitive benchmarking and strategic planning. The medical device contract sales organization market reached 4.26 billion in 2026.
Source: https://www.precedenceresearch.com/medical-device-contract-sales-organizations-market
 Get a Sample
 Table Of Content


Medical Device Contract Sales Organizations (CSO) Market Size and Forecast 2026 to 2035
With more than five years of healthcare and medical device market analysis experience, Deepa Pandey believes the medical device contract sales organizations market is now in a new phase. Contract sales organisations are becoming an increasingly important part of traditional sales organisations. As manufacturers adopt more flexible commercial models, pressure to manage selling costs grows, and there is an increasing need for specialized sales skills.
The global value of the medical device contract sales organization market is expected to grow at a CAGR of 7.03% throughout the forecast period. Deepa Pandey sees a trend that's growing away from rigid internal sales organizations and towards more flexible outsourced sales forces, especially among new medical device companies and those in new therapeutic or geographic markets.
Key Takeaways
- By service type, the personal/direct commercial promotion segment led the market with a share of 72.85 in 2026.
- By personal/direct commercial promotion, the field sales and sales force outsourcing segment led the market with a 38.40% share in 2026.
- By non-personal/indirect commercial support, the sales training and product education segment captured a major revenue share of 31.85% in 2026.
- By therapeutic area, the cardiovascular segment captured the largest market share of 22.75% in 2026.
- By end user, the large medical devices companies segment led the market with a 51.65% share in 2026.
- IQVIA outscales peers by a lot, as it has almost 8 times the number of employees as Inizio and more than 14 times that of Amplity.
- With its international reach and 30 years of contract sales experience, Inizio has acquired the trust of many of the world's top pharmaceutical companies.
- Strong client relationships are built on a very specialized and skilled team, with an average tenure of top clients of 10 years.
- IQVIA is top-ranked in all of the metrics disclosed in this press release, driving its leadership in the crowded market.
- Few reports are openly available across the competitors, limiting the extent of benchmarking that can be done and leaving key competitors under-researched.
Market Overview
The medical device contract sales organizations (CSO) market reached USD 4.26 billion by 2026 and is expected to expand at a rate of 7.03% CAGR between 2026 and 2035. There are also outsourced commercial services available to medical device companies to help them deploy sales teams. Further offer clinical and technical support for selling, support key accounts, educate healthcare professionals, support distributors, and enter into new markets.
The market is gaining growth momentum, with more manufacturers outsourcing their sales and commercial activities to manage costs, access the expertise of medical device sales teams, and meet the increasing complexity of their medical device portfolios. But CSOs are growing in significance for companies looking to distribute to physicians, procurement groups, hospitals, and other healthcare influencers without the heavy commitment of a big sales unit.
Which Leading Medical Device Contract Sales Organizations Have the Largest Workforce?
| Company | Employees |
| IQVIA | 88,000 |
| Inizio | 10,500 |
| Inizio Historical Workforce | 11,500 |
| EVERSANA | 6,000 |
| Amplity Health | 5,000 |
Workforce size is one of the more reliable proxies for operating scale in this industry. A contract sales organization's core product is essentially trained commercial headcount. At 88,000, IQVIA is a long way ahead and is a diversified healthcare data and commercial-services company. The drop-off of 1,000 staff in Inizio is notable, as it comes on the heels of a drop of 1,600 from a peak of 11,500 in the past. That brings it to a new company-wide number of 10,500. EVERSANA has 6,000 employees, while Amplity Health adds up to 5,000. The gap between IQVIA and the next tier is significant enough that workforce size must be considered a proxy for its relative size in the medical device commercial outsourcing service line. Particularly in part because not all of its employees are engaged in that service line.
Key Insight: The number of employees working for IQVIA (88,000) is significantly larger than Inizio's (10,500), EVERSANA's (6,000), and Amplity's (5,000).
Source: Precedence Research Database
How Many Contract Sales and Commercial Services Companies Compete in the Leading CSO Universe?
| Company | Competitive Universe Position |
| IQVIA | 1 |
| Syneos Health | 2 |
| Amplity Health | 3 |
| EVERSANA | 4 |
| Inizio Engage | 5 |
| EPS Corporation | 6 |
| CMIC Holdings | 7 |
| Uniphar | 8 |
| Axxelus | 9 |
| MaBico | 10 |
Among the dominant companies in the CSO segment, IQVIA is at the top, and next are Syneos Health, Amplity Health, and EVERSANA. These are the top commercial outsourcing providers that are known for their extensive services, therapeutic skills, and size. Established players like Inizio Engage (San Diego), EPS Corporation, CMIC Holdings, Uniphar (Houston), Axxelus, and MaBico (St. Paul) also offer niche features and regional specializations. It's a competitive mix that indicates a vibrant market that will keep providing useful areas of differentiation and increase for businesses that vie on the basis of scale of their field force, of their customer reach, on the basis of innovation, and on the basis of commercialisation excellence.
Key Insight: IQVIA, Syneos Health, and Amplity Health are the top three companies in the 10-company competitive universe, but quality of disclosure decreases significantly further down, making it difficult to precisely compare these lower-ranked companies.
Source: Precedence Research Database
How Many Countries Does Inizio Cover Through Its Global Healthcare Commercial Network?
| Geographic Metric | Number |
| Countries | 50 |
| Therapeutic Areas | 14 |
| Top Global Pharmaceutical Companies Served | 20 |
| Years of Contract Sales Experience | 30 |
Inizio's global presence is found in 50 countries and deployed in 14 therapeutic areas. Its top-20 global pharmaceutical clients indicate that it possesses extensive trust. That's the very level required to capture and keep business at this level. It has 30 years of contract sales expertise, which predates many of the current offerings of outsourced commercial solutions in the medical device and pharmaceutical sector.
Key Insight: Trust at the highest levels of the industry is demonstrated in Inizio's 50-country presence and 30 years of contract sales experience, which has led to a roster of 20 of the world's leading pharmaceutical companies.
Source: Precedence Research Database
What Revenue Scale Has Inizio Reported?
| Financial Metric | Value |
| Revenue USD Billion | 2 |
| Offices | 35 |
| Employees | 11,500 |
| Countries | 50 |
According to Inizio, its revenue is USD 1.5 billion, with 35 offices and 11,500 employees in 50 countries. On this smaller scale, just a small fraction of the size of IQVIA, Inizio's place is easily the second tier in the disclosed comparison group, and a company that has some real global reach, but a significantly lower revenue run-rate than the top dogs in the market.
Key Insight: With 50 countries across at least 35 offices, and a USD 1.5 billion revenue total, Inizio is the biggest second-tier player behind IQVIA among companies sharing similar financial information.
Source: Precedence Research Database
How Large Is Inizio's Specialized Scientific Workforce?
| Workforce Metric | Number |
| Total Employees | 11,500 |
| PhDs | 750 |
| Nurses | 850 |
| Top Client Relationship Duration Years | 10 |
In addition to the number of people on staff, Inizio's employee base suggests that it is truly clinically minded. Of these 11 500 total employees, 750 have PhDs, and 850 are nurses, an idea that is helping to ensure the type of scientifically validated engagement that is increasingly needed to market complicated, procedure-based medical technology. Additionally, Inizio says it has an average of 10 years of business relationship with its biggest clients, and this greater depth of knowledge drip-feeds over time, not just one hit at the signing of a contract.
Key Insight: The 750 PhDs and 850 nurses, working alongside an 11,500-person staff, build the clinical credibility behind the 10-year average relationship length with its top clients as reported.
Source: Precedence Research Database
How Many Years of Contract Sales Experience Does Inizio Engage Have?
| Company | Contract Sales Experience Years |
| Inizio Engage | 30 |
| IQVIA | 40+* |
| Amplity | 20+* |
| EVERSANA | 10+* |
Inizio Engage has 30 years of contract sales experience. IQVIA reports over 40 years, which is the longest time among the companies reporting. Amplity reports over 20 years, and EVERSANA more than 10 years. The length of disclosure does not necessarily correlate with an increased current footprint, given EVERSANA's history. The more meaningful the revenue and headcount, the smaller the footprint is, but there is a strong correlation between the length of disclosure and the depth of the institutional client relationships that each company can claim or point to.
Key Insight: IQVIA's track record of 40+ years with contract sales gives it the edge in the disclosed comparison over fellow companies Inizio Engage, Amplity, and EVERSANA, which have 30, 20+, and 10+ years of operating size, respectively, but no direct correlation between the two.
Source: Precedence Research Database
Expanded Numbers-Only Company Comparison Dataset
Which Companies Have the Largest Measurable Operating Scale in the Medical Device CSO Ecosystem?
| Metric | IQVIA | Inizio | EVERSANA | Amplity |
| Revenue USD Billion | 16 | 1.5 | 1 | 0 |
| Employees | 88,000 | 11,500 | 6,000 | 5,000 |
| Countries | 100 | 50 | 0 | 0 |
| Offices / Locations | 304 | 35 | 20 | 0 |
| Therapeutic Areas | 0 | 14 | 100 | 0 |
| Clients | 10,000 | 0 | 670 | 0 |
| Contract Sales Experience Years | 0 | 30 | 0 | 0 |
According to IQVIA, it generates USD 16.31 billion in revenue, employs 88,000 people, and operates in 100 countries. They have 304 offices or locations and serves 10,000 clients. Inizio says its revenue is USD 1.50 billion, its workforce is 11,500, it operates in 50 countries, has 14 therapeutic areas and 14 offices, and has 30 years of contract sales experience. EVERSANA reports USD 1.00 billion in revenue, with 6,000 employees, 100 therapeutic areas covered, 670 clients, and 20 offices. But it does not continue to report its experience in years or its country count publicly. The only thing that Amplity divulges about its employees is that it has 5,000, whereas every other metric in this comparison is left blank.
Key Insight: IQVIA leads every disclosed metric in this four-company comparison, from USD 16.31 billion in revenue to 10,000 clients, but the comparison itself is limited by how selectively Amplity and EVERSANA report their own operating figures.
Source: Precedence Research Database
How Many Healthcare Professionals and Commercial Partners Can IQVIA's Data Infrastructure Reach?
| Network Metric | Number |
| Employees | 88,000 |
| Contract Sales & Medical Solutions Employees | 6,000 |
| Countries | 100 |
| Product Tracking Markets | 95 |
| Patient Records | 1,20,00,00,000 |
IQVIA has 88,000 total staff. Around 6,000 work in the contract sales and medical solutions business line, which is most similar to the other companies in this analysis. The company serves 100 countries and covers product data in 95 different markets on the basis of a database of 1.2 billion patient records. This data makes IQVIA unique from the other businesses in the market. It can support commercial deployment decisions with real-world evidence that smaller, sales-focused competitors cannot replicate.
Key Insight: IQVIA has 6,000 employees and 1.2 billion patient records in 95 countries tracked by IQVIA.
Source: Precedence Research Database
Which Numerical Indicators Can Be Used to Compare More Medical Device CSO Companies?
| Company | Revenue USD Billion | Employees | Countries | Locations |
| IQVIA | 16 | 88,000 | 100 | 304 |
| Inizio | 2 | 11,500 | 50 | 35 |
| EVERSANA | 1 | 6,000 | 0 | 20 |
| Amplity | 0 | 5,000 | 0 | 0 |
| Syneos Health | 0 | 0 | 0 | 0 |
| EPS Corporation | 0 | 0 | 0 | 0 |
| CMIC Holdings | 0 | 0 | 0 | 0 |
| Uniphar | 0 | 0 | 0 | 0 |
According to IQVIA, it has USD 16.31 billion in revenue, 88,000 employees, 100 countries, and 304 locations. Inizio claims to generate USD 1.50 billion in revenue, has 11,500 employees, 35 locations, and operates in 50 countries. EVERSANA reports 6,000 employees and 20 locations with no reported revenue, country, or client number beyond what was seen in the previous comparison. Amplity has 5,000 employees.
Among the top ten companies in the larger competitive universe covered previously, none publicly disclose any of the four metrics that are used for this comparison. That difference between the competitive ranking and operating details disclosed is telling, as it indicates that there are a number of market players that are pretty competitive who don't report the sort of granular details that IQVIA and Inizio do.
Key Insight: Only IQVIA, Inizio, EVERSANA, and Amplity disclose any of the four core operating metrics tracked here, meaning four of the ten companies in the broader competitive universe, including second-ranked Syneos Health, remain effectively unbenchmarked on public data alone.
Source: Precedence Research Database
Segmentation Analysis
Service Type Insights
| Segment | 2026 Share (%) | 2035 Share (%) | CAGR | Growth Factor |
| Personal/Direct Commercial Promotion | 7285.00% | 68.4 | 6.35% | Direct engagement with healthcare providers and hospitals remains essential for complex medical devices. |
| Non-Personal/Indirect Commercial Support | 2715.00% | 31.6 | 8.55% | Growth in analytics, training, remote engagement and channel support accelerates demand. |
In 2026, personal and direct commercial promotion still leads the way with 72.85% of the market share and will grow to 68.40% at a CAGR of 6.35% by 2035 due to continued high demand for direct interaction with healthcare providers and hospitals for the sale of complex medical devices. On the other hand, non-personal and indirect commercial support is gaining market share from 27.15% to 31.60% at an 8.55% CAGR, alongside the core sales role, as key areas such as analytics, training, remote engagement, and channel support grow in significance.
Key Insight: Non-personal and indirect commercial support is outpacing direct promotion at a CAGR of 8.55%, and by 2035 will capture more than four points of market share as manufacturers incorporate technology around their primary sales effort.
Source: Precedence Research Database
Personal/Direct Commercial Promotion Insights
| Segment | 2026 Share (%) | 2035 Share (%) | CAGR | Growth Factor |
| Field Sales & Sales Force Outsourcing | 38.4 | 35.25 | 5.80% | Manufacturers continue outsourcing dedicated field teams to expand coverage efficiently. |
| Key & Strategic Account Management | 22.15 | 25.8 | 8.25% | Complex hospital networks and strategic accounts require specialized relationship management. |
| Clinical & Technical Sales Support | 26.35 | 28.65 | 8.00% | Advanced and procedure-based devices require greater clinical and technical expertise. |
| Inside & Remote Sales | 13.10 | 11.3 | 5.15% | Remote engagement expands coverage, particularly for routine account interactions. |
Field sales and sales force outsourcing is the largest segment of direct commercial promotion in 2026 with 38.40% market share. This is growing at the slowest rate of the four segments, with a 5.80% CAGR to reach a 35.25% share in 2035, as its growth rate is still behind the category average. At 26.35% market share, clinical and technical sales support is expected to expand to 28.65% at 8.00% CAGR, driven by the increased clinical and technical knowledge needed by advanced, procedure-driven devices.
The fastest of the four, key and strategic account management is growing from 22.15% of the market to 24.80%, at an 8.25% CAGR, as more complex hospital networks are requiring more specialized relationship management than standard field coverage. The smallest market share, 13.10% for inside and remote sales, will grow at 5.15% CAGR into an 11.30% market share, but will still be useful in maintaining an account.
Key Insight: As the healthcare environment becomes more sophisticated and intricate, key and strategic account management is poised to experience the highest growth rate at 8.25% CAGR, outpacing clinical and technical sales support.
Source: Precedence Research Database
Non-Personal/Indirect Commercial Support Insights
| Segment | 2026 Share (%) | 2035 Share (%) | CAGR | Growth Factor |
| Sales Training & Product Education | 31.85 | 29.4 | 6.25% | Continuous training is required for increasingly complex medical technologies. |
| Channel & Distributor Support | 27.2 | 25.85 | 6.50% | International expansion increases the need for distributor coordination and management. |
| Sales Operations & Analytics | 22.65 | 26.9 | 9.15% | Data-driven territory management and sales-force optimization support rapid growth. |
| Commercial Intelligence | 11.4 | 12.75 | 8.20% | Manufacturers increasingly require market insights and performance monitoring. |
| Other Support Services | 6.9 | 5.1 | 4.20% | Specialized support services remain comparatively niche. |
Sales training and product education lead this segment with 31.85% market share in 2026 and are projected to grow further at 6.25% CAGR to reach 29.40% by 2035 as medical technologies evolve constantly and demand for retraining. The market share of channel & distributor support is 27.20% with a slight decline of 6.50% CAGR. This reflects the coordination needs of its international expansion.
Sales operations and analytics saw its share rise from 22.65% to 26.90% with a CAGR of 9.15%. This will grow at the fastest pace in the table, as data becomes a true differentiator in territory management and sales-force optimization rather than just a back-office role. Commercial intelligence is also growing at a moderate CAGR of 8.20%, gaining market share from 11.40% to 12.75%.
Key Insight: Sales operations and analytics are the fastest-growing within indirect commercial support, with a year-on-year growth of 9.15% CAGR, rising to 26.90% market share with the rise of data-driven territory management beyond mere support to a true differentiator.
Source: Precedence Research Database
Therapeutic Area Insights
| Segment | 2026 Share (%) | 2035 Share (%) | CAGR | Growth Factor |
| Cardiovascular | 23 | 21 | 6.10% | Large cardiovascular device portfolios and specialist selling requirements support leadership. |
| Orthopedics | 17 | 16 | 5.95% | Procedure-based products require ongoing clinical and technical sales support. |
| Neurology | 10 | 11 | 7.65% | Advanced neurostimulation and neurological technologies support expansion. |
| Oncology | 12 | 15 | 9.75% | Growing adoption of advanced diagnostic and treatment technologies drives rapid demand. |
| Diabetes & Metabolic Disorders | 13 | 13.4 | 7.75% | Continuous monitoring and insulin-delivery technologies expand commercial opportunities. |
| Respiratory | 8 | 7.2 | 6.25% | Demand for respiratory monitoring and therapeutic devices supports steady growth. |
| General Surgery | 9.35 | 9.85 | 7.45% | Minimally invasive and technology-intensive surgical systems require specialized support. |
| Other Therapeutic Areas | 8.05 | 6.75 | 5.40% | Demand remains distributed across multiple specialty-device categories. |
Cardiovascular is the largest therapeutic area with a 2026 market share of 22.75%, which will continue to increase at 6.10% CAGR to 20.65% by 2035, driven by large device portfolios and specialist selling needs. Orthopedics has a market share of 17.40%, which is slated to rise at 5.95% CAGR, linked to procedure-based products that need continuous technical and clinical assistance.
Diabetes and metabolic disorders have a 12.60% market share, which will increase by 7.75% CAGR as new technologies for continuous monitoring and insulin delivery grow in commercial opportunity. Neurology expands from 10.25% to 10.85% market share from 2026 to 2035 at a 7.65% CAGR, with the backing of the advanced technology of neurostimulation.
General surgery expands at a 7.45% CAGR from 9.35% to 9.85% market share because the surgical systems involve less human intervention and more technology. On the other hand, oncology is set apart from all the above, with the highest market share growth from 11.85% to 15.45% at a CAGR of 9.75%, due to the increasing adoption of advanced diagnostic and therapeutic technologies.
Key Insight: Oncology has the fastest growth of all therapeutic areas at 9.75%. Also, cardiovascular has the seventh-largest share of the total market over the forecast period, trailing only HIV, Immunology, and Oncology, yet ahead of all other areas.
Source: Precedence Research Database
End User Insights
| Segment | 2026 Share (%) | 2035 Share (%) | CAGR | Growth Factor |
| Large Medical Device Companies | 51.65 | 47.8 | 6.15% | Broad portfolios and multi-market operations generate substantial outsourced commercial requirements. |
| Mid-Sized Medical Device Companies | 33.2 | 37.15 | 8.30% | Companies increasingly use CSOs to enter new markets without building extensive internal teams. |
| Small & Emerging Medical Device Companies | 15.15 | 15.05 | 6.95% | Product launches and limited internal commercial infrastructure support outsourcing. |
Large medical device companies remain the primary customer group at 51.65% market share in 2026, shrinking to 47.80% by 2035 at 6.15% CAGR. Indicating that large medical device companies have a significant outsourced commercial requirement due to their broad, multi-market portfolios. The market share of mid-sized medical device companies rose from 33.20% to 37.15% and is expected to grow at 8.30% CAGR, outpacing the growth of large companies. Small and emerging medical device companies have the least market share at 15.15%, which is expected to grow at a 6.95% CAGR on the back of product launches and a lack of internal commercial infrastructure.
Key Insight: Out of all the end users, mid-sized medical device companies are projected to grow fastest at 8.30% CAGR due to increasing their reliance on outsourcing commercial teams over building them in-house.
Source: Precedence Research Database
Engagement Model Insights
| Segment | 2026 Share (%) | 2035 Share (%) | CAGR | Growth Factor |
| Dedicated Sales Teams | 39.25 | 35.6 | 6.05% | Complex products often require fully trained and dedicated representatives. |
| Shared Sales Teams | 27.15 | 25.85 | 6.55% | Cost efficiency makes shared teams attractive for smaller portfolios. |
| Flexible/On-Demand Teams | 22.4 | 2865.00% | 10.05% | Manufacturers increasingly require scalable commercial resources. |
| Project-Based Engagements | 6.35 | 595.00% | 6.35% | Product launches and temporary market-expansion initiatives support demand. |
| Performance-Based Engagements | 4.85 | 395.00% | 4.70% | Outcome-focused contracts remain relevant for specific commercial programs. |
Despite the more complex nature of products, dedicated sales teams (39.25% market share in 2026) are the segment with the most proportionate decrease, advancing at a 5.90% CAGR to 35.60% market share in 2035. Shared sales teams have 21.45% market share, which dropped slightly to 20.85% at a 6.70% CAGR. This is appealing for the cost efficiency provided for smaller portfolio sizes. Project-based engagements are growing slowly from 12.65% to 12.90% in market share with a CAGR of 7.25%. This is closely related to product launches and short-term market expansion projects.
Performance-based engagements have seen a decline in market share from 8.35% to 8.00% with a CAGR of 6.55%. Thus, the two engagement models that are growing the most rapidly are flexible and on-demand teams, with market share expanding from 18.30% to 22.65% at a 9.25% CAGR, as manufacturers are increasingly interested in commercial resources that are scalable rather than long-term commitments.
Key Insight: Flexible and on-demand teams are the fastest-growing team model in the table at 9.25% CAGR, whereas dedicated sales teams, the largest team model at 39.25% share, have the slowest growth in the table at 5.90%.
Source: Precedence Research Database
Main Segment Snapshot
| Segmentation | Largest Segment in 2026 | Share | Fastest-Growing Segment |
| By Service Type | Personal/Direct Commercial Promotion | 72.85% | Non-Personal / Indirect Commercial Support |
| By Direct Promotion | Field Sales & Sales Force Outsourcing | 38.40% | Key & Strategic Account Management |
| By Indirect Support | Sales Training & Product Education | 31.85% | Sales Operations & Analytics |
| By Therapeutic Area | Cardiovascular | 22.75% | Oncology |
| By End User | Large Medical Device Companies | 51.65% | Mid-Sized Medical Device Companies |
| By Engagement Model | Dedicated Sales Teams | 39.25% | Flexible / On-Demand Teams |
| By Region | North America | 39.25% | Asia Pacific |
Throughout all of these measures, there is a uniform trend. In 2026, it's not always the fastest-growing segment; it could be direct commercial promotion, field sales outsourcing, sales training, cardiovascular devices, large medical device companies, or dedicated sales teams, or it could be North America. Growth instead concentrates in segments built around flexibility, analytics, and specialization for segments such as non-personal commercial support, sales operations and analytics, oncology, mid-sized device companies, flexible engagement teams, and Asia Pacific. That divide between where the market's current revenue sits and where its incremental growth is actually heading is the single clearest structural signal running through this entire analysis.
Key Insight: Non-personal commercial support, sales operations and analytics, oncology, mid-sized device companies, and flexible engagement teams are major growth segment opportunities for the market.
Source: Precedence Research Database
Region Insights
| Region | 2026 Share (%) | 2035 Share (%) | CAGR | Growth Factor |
| North America | 39 | 36 | 6.05% | Large medical device markets and established outsourcing practices support leadership. |
| Europe | 27 | 26 | 6.55% | Complex healthcare systems and demand for local commercial expertise support growth. |
| Asia Pacific | 22 | 29 | 10.05% | Healthcare expansion, medical device adoption and demand for localized sales capabilities drive rapid growth. |
| Latin America | 6 | 6 | 6.35% | Expanding healthcare access supports gradual market development. |
| Middle East & Africa | 5 | 395.00% | 4.70% | Developing medical device infrastructure creates selective outsourcing opportunities. |
North America is leading the region at 39.25% market share in 2026 with a 6.05% CAGR in 2026 to 35.60% by 2035, with the size of the domestic medical device industry and the established outsourcing practices in the region. Europe accounts for 27.15% of the market and is decreasing to 25.85% at 6.55% CAGR. Driven by a complex healthcare system where commercial expertise is needed on a local level.
Rising revenue from healthcare expansion, the increasing acceptance of medical devices, and the need for localized sales expertise are all driving growth together in Asia Pacific, with a 10.05% CAGR, and climbing from 22.40% to 28.65% market share and the fastest growth rate in the region. As developing medical device infrastructure provides selective outsourcing opportunities in the Middle East and Africa, market share drops from 4.85% to 3.95% at a 4.70% CAGR, the lowest in the tabular comparison, in Latin America, while the market share declines from 6.35% to 5.95% at a 6.35% CAGR.
Key Insight: Asia Pacific is the fastest-growing region, gaining at 10.05% CAGR to become 28.65% of the market, while North America is losing the most market share, trailing in the overall size in 2035.
Source: Precedence Research Database
Expert Insights
Moving the medical device industry from a traditional sales organization to more flexible, specialized, and technology-based commercial structures. I believe there are some pretty good synergies between niche clinical skills, scalable sales teams, and data-based engagement with customers. Medical device companies are facing greater pressure than ever before to introduce new products quickly, enter new markets, and keep commercial expenses in check without establishing big, permanent sales teams. This change will likely help bolster the position of contract sales companies throughout the medical device value chain. I state that the complexity of medical device portfolios and the need to make the sales force more productive will be a key driver of competitiveness for the next 10 years.
Our Experts
Deepa Pandey led the primary market research and methodology development and spearheaded the analysis of market segmentation, regional trends, competitive dynamics, outsourcing models, and market forecasts, which laid the basis of the report.
Aman handled the validation and collection of regulatory information, company financial data, industry disclosures, outsourcing agreements, and other quantitative data obtained from independent sources, thus augmenting the evidence base supporting the market estimation.
Aditi read through the entire research document and did quality checks and consistency checks, validated the findings, refined the document, and corrected any inconsistencies to ensure the report is accurate and clear.
Segments Covered in the Report
By Service Type
- Personal/Direct Commercial Promotion
- Non-Personal/Indirect Commercial Support
By Personal/Direct Commercial Promotion
- Field Sales & Sales Force Outsourcing
- Key & Strategic Account Management
- Clinical & Technical Sales Support
- Inside & Remote Sales
By Non-Personal/Indirect Commercial Support
- Sales Training & Product Education
- Channel & Distributor Support
- Sales Operations & Analytics
- Commercial Intelligence
- Other Support Services
By Therapeutic Area
- Cardiovascular
- Orthopedics
- Neurology
- Oncology
- Diabetes & Metabolic Disorders
- Respiratory
- General Surgery
- Other Therapeutic Areas
By End User
- Large Medical Device Companies
- Mid-Sized Medical Device Companies
- Small & Emerging Medical Device Companies
By Engagement Model
- Dedicated Sales Teams
- Shared Sales Teams
- Flexible/On-Demand Teams
- Project-Based Engagements
- Performance-Based Engagements
By Region
- North America
- Europe
- Asia Pacific
- Latin America
- Middle East & Africa
Questions This Report Deliberately Leaves Open
- What size would the medical device contract sales organizations be in 2030 and 2035?
- Despite the fact that direct promotion still makes up almost three-quarters of the market, why is Non-Personal/Indirect Commercial Support growing faster, at 8.55% CAGR?
- How can smaller, niche CSOs keep pace with IQVIA in terms of contracts for medical device manufacturers, when the company employs 88,000 people in 100 countries and has a revenue of $16.31 billion?
- Inizio's reported workforce has moved from a historical 11,500 employees to around 10,500. Is this simply a reporting difference, or could it indicate something about changing demand and operating models within the CSO market?
- Where should CSOs place their next major investment in specialized sales capabilities? Should they focus on oncology, which is growing fastest at a 9.75% CAGR, or Cardiovascular, which currently represents the largest share at 22.75%?
- How should mid-sized medical device companies (33.20% to 37.15% share, fastest-growing end-user segment at 8.30% CAGR) be prioritized differently from large device manufacturers by CSO providers?
- Flexible/on-demand teams are growing at a 9.25% CAGR, making them the fastest-growing engagement model. How quickly could this model challenge Dedicated Sales Teams as the preferred approach to commercial outsourcing?
- There are many “0 = not publicly identified” codes in the company comparisons. What is the impact of this lack of disclosure on the credibility of competitive ranking and comparisons between CSO providers?
- Asia-Pacific is expected to increase its market share from 22.40% to 28.65% and is the fastest-growing major region, with a 10.05% CAGR. Which CSOs are best positioned to take advantage of this expansion?
- Is IQVIA's prospect of remaining the highest flyer in a competitive universe clear-cut if it compares its wider universe of life-sciences data and analytics to more specialised in-house contract-sales firms such as Amplity and EVERSANA?
- Inizio's specialist scientific staff (750 PhDs; 850 of the 11,500 employees are nurses) gives insights into how CSOs are positioning themselves relative to a focus on sales staff alone in the field of clinical credibility?
- As manufacturers are ratcheting up price negotiations on commercial outsourcing, which engagement structure, Performance-Based Engagements vs. Project-Based Engagements, is more defensible for CSOs?
- How should smaller and privately held CSOs (Syneos Health, EPS Corporation, CMIC Holdings, Uniphar) be evaluated when so few public financial or scale metrics are available?
- Which is the realistically achievable target in Sales Operations & Analytics – the fastest-growing indirect-support category (9.15% CAGR)?
- With the growing trend towards flexible and shared sales in the marketplace, how can a medical device manufacturer decide on creating an in-house commercial team versus outsourcing to a CSO?
References
Precedence Research Database
"Medical Device Contract Sales Organizations Market — Company Landscape, Competitive Analysis, and Segmentation Data"
Data used: Market size, CAGR, all company workforce/scale/comparison tables, and all segment share/CAGR tables presented throughout this report.
For inquiries regarding discounts, bulk purchases, or customization requests, please contact us at sales@precedenceresearch.com
Frequently Asked Questions





Ask For Sample
No cookie-cutter, only authentic analysis – take the 1st step to become a Precedence Research client
 Get a Sample
.webp)



 sales@precedenceresearch.com
 Schedule a Meeting