Outsourcing Services Market Trends, Leading Companies, Company Revenue / Sales Performance, Subscriber Growth, Pricing Strategies, Cloud Adoption, Infrastructure Expansion, Competitive Landscape, and Industry Outlook
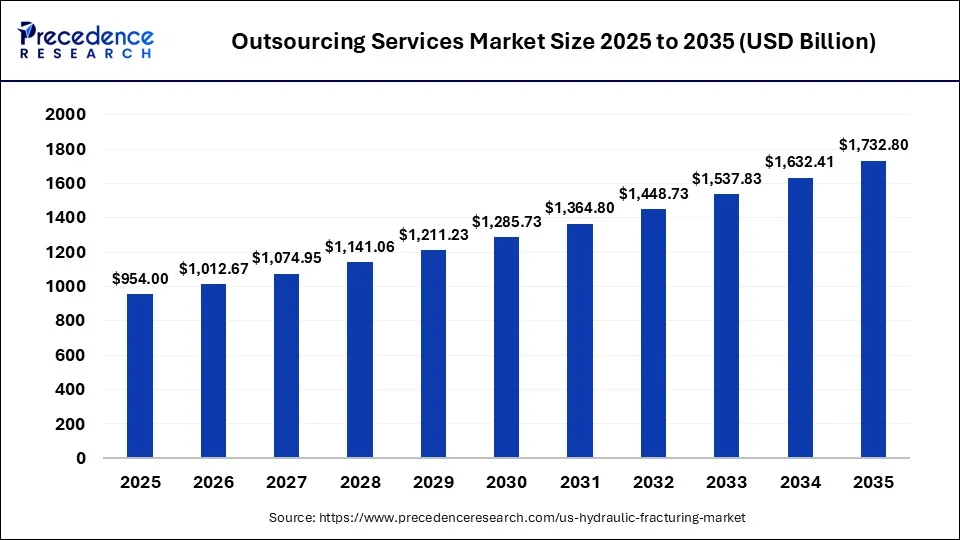
The outsourcing services market was valued at USD 1,012.67 billion in 2026, expanding at a CAGR of 6.15% through 2035. Market growth is driven by rising demand for cost-efficient, specialized, and scalable services across IT, business processes, manufacturing, healthcare, and professional services. Key trends include digitalization, cloud adoption, automation, AI-enabled delivery, and increasing focus on core business operations.
Source: https://www.precedenceresearch.com/outsourcing-services-market
 Get a Sample
 Table Of Content


Outsourcing Services Market Analysis, Demand and Growth Rate Forecast 2035
The outsourcing services market is forecasted to expand from USD 1,012.67 billion in 2026 to USD 1,732.80 billion by 2035, growing at a CAGR of 6.15% from 2026 to 2035.
 Key Takeaways
- Rising demand for cost-efficient, scalable, and specialized external services is supporting continued outsourcing adoption.
- IT, business process, professional, and specialized outsourcing services remain key areas of enterprise spending.
- Companies are increasingly balancing offshore, nearshore, onshore, and hybrid delivery models based on cost and capability requirements.
- Large enterprises remain major outsourcing users, while SMEs are increasingly outsourcing non-core functions to access specialized expertise.
- AI, automation, cloud platforms, and digital collaboration tools are reshaping outsourcing delivery and productivity.
- Asia Pacific remains an important outsourcing hub, supported by skilled talent availability, competitive costs, and expanding digital capabilities.
- Pricing varies significantly by service complexity, delivery location, talent profile, contract structure, and service-level requirements.
- Providers are differentiating through domain expertise, technology capabilities, integrated services, and global delivery networks.
- Growing focus on core competencies is creating opportunities for specialized outsourcing providers with measurable cost and performance advantages.
Why Outsourcing is Shifting from Labor Arbitrage Toward AI-Enabled Business Outcomes?
The market definition used in this analysis covers third-party delivery of IT infrastructure and applications, knowledge and analytics services, business-process services, and outsourced engineering, while excluding captive internal centers and thus avoiding double counting of subcontracted revenue.
North America represents the largest demand pool at nearly USD 440 billion, or about 38% of 2026 revenue, while Asia Pacific generates roughly USD 346 billion and is expected to grow faster at approximately 10% annually through 2035. Europe contributes approximately USD 298 billion, with Latin America and the Middle East & Africa representing smaller but faster-developing delivery and nearshore markets.
The market is no longer defined purely by wage arbitrage. Managed services, cloud operations, data engineering, AI integration, cybersecurity, finance transformation, customer experience, engineering services, and industry-specific operations are increasingly being bundled into multi-year, outcome-oriented contracts. Business process outsourcing represented nearly 38.7% of 2026 outsourcing revenue in one market segmentation, while managed services accounted for approximately 46.2%, highlighting the industrys movement toward recurring, technology-enabled service relationships.
Key Coverage
- Largest demand region: North America.
- Fastest-growing major region: Asia Pacific.
- Large-enterprise contribution: 68.9%.
- Managed-services share: 45.2%.
- BPO share: 37.7%.
- Increasing migration toward AI-enabled, outcome-based contracts.
Why Managed Services and Knowledge-Intensive Outsourcing are Capturing More Strategic Spend?
The market is segmented across IT outsourcing, business process outsourcing, knowledge process outsourcing, engineering services, delivery model, managed services, enterprise size, end-use industry, and geography. BPO remains one of the largest pools, accounting for approximately 38.7% of 2026 outsourcing revenue, but the faster strategic shift is occurring in higher-value services such as analytics, AI implementation, engineering, cybersecurity, and cloud operations.
Large enterprises represent approximately 68.9% of market spending, reflecting the complexity of multinational contracts, regulatory requirements, and the economics of consolidating multiple functions with strategic providers. SMEs remain smaller but represent an important growth opportunity as cloud delivery, standardized platforms, and consumption-based contracts lower the minimum scale required to outsource. BFSI represents approximately 29.6% of demand, making financial services the largest major vertical, while healthcare is among the faster-growing industry opportunities.
Key Coverage
- Service-type revenue and CAGR.
- BPO vs IT vs KPO vs engineering.
- Managed vs project-based contracts.
- Onshore, nearshore, and offshore mix.
- \Enterprise-size segmentation.
- BFSI, healthcare, manufacturing, retail, and technology.
- Regional and country-level segmentation.
Market Dynamics - Cost Optimization Remains the Entry Point, but AI is Redefining the Value Proposition
Cost reduction remains fundamental, but outsourcing decisions increasingly combine cost, speed, scarce talent access, resilience, automation and transformation capability. Enterprises are outsourcing functions that require specialist skills without wanting to build equivalent internal teams.AI is simultaneously a growth catalyst and a pricing threat.
Providers can automate repetitive service delivery, but clients increasingly expect part of those productivity gains to appear as lower unit costs or outcome-linked pricing. Recent industry evidence shows Indian IT services providers facing declining revenue per unit of work as AI-driven productivity gains are partially passed to customers. The resulting strategic tension is significant: providers need to increase revenue per employee through higher-value services while preventing automation from simply shrinking billable hours.
Key Coverage
- Cost-arbitrage economics.
- AI productivity impact.
- Cloud migration.
- Talent shortages.
- Cybersecurity requirements.
- Data-residency pressures.
- Vendor consolidation.
- Outcome-based contracting.
Tentative Leading Company Universe
| Company | Headquarters | Market Position | Core Strength |
| Accenture | Ireland | Global leader | End-to-end technology & managed services |
| Tata Consultancy Services | India | Scale leader | IT services & transformation |
| Capgemini | France | Global leader | Technology, engineering & operations |
| Cognizant | U.S. | IT/BPS leader | Digital operations & technology |
| NTT DATA | Japan | Global IT leader | Managed services & enterprise IT |
| HCLTech | India | Technology leader | IT, engineering & managed services |
| Infosys | India | Global IT leader | Digital, cloud & AI |
| Wipro | India | Global IT/BPS provider | IT transformation & operations |
| Kyndryl | U.S. | Infrastructure specialist | Managed infrastructure |
| CGI | Canada | IT services leader | Government & enterprise services |
| Tech Mahindra | India | IT/BPS challenger | Telecom & enterprise services |
| Genpact | U.S. | BPS/KPO leader | Finance, operations & analytics |
| Concentrix | U.S. | CX/BPS leader | Customer experience |
| TP | France | CX/BPS leader | Customer care & specialized services |
| EXL | U.S. | Analytics/KPO specialist | Data, analytics & operations |
| WNS | India | Digital BPS specialist | Industry-specific operations |
| EPAM | U.S. | Engineering specialist | Digital engineering |
| Mphasis | India | Digital services provider | Cloud & financial services |
| LTIMindtree | India | IT challenger | Digital transformation |
| Hexaware | India | Mid-market challenger | Cloud, automation & IT |
| TaskUs | U.S. | CX/AI specialist | AI services & trust/safety |
| Conduent | U.S. | BPS specialist | Transaction processing |
| TELUS Digital | Canada | CX/AI provider | Digital CX & AI data |
| Sutherland | U.S. | BPS/CX specialist | Digital operations |
| Foundever | Luxembourg | CX specialist | Customer experience outsourcing |
Which Competitive Dynamics Will Determine Leadership in the Outsourcing Services Market?
The outsourcing services market is highly fragmented by service type but increasingly concentrated at the top among providers with the scale to combine technology, global delivery, industry expertise, and managed-service capabilities. The leading 25-provider universe spans IT services, infrastructure management, business process services, customer experience, engineering, analytics, and specialized knowledge services, with the largest global providers generating annual revenues ranging from roughly USD 10 billion to more than USD 70 billion. Our assessment is that scale alone is no longer sufficient to secure competitive advantage as the market is shifting toward providers that can combine large delivery networks with AI-enabled automation, cloud modernization, cybersecurity, data engineering, and higher-value consulting capabilities.
Competitive intensity is particularly high because buyers can compare providers across price, delivery location, technical depth, automation capability, industry specialization, and service-level performance. Offshore delivery remains a major cost lever, while nearshore and regional delivery are becoming increasingly important for regulated workloads, language-sensitive operations, and applications requiring closer client interaction. At the same time, AI is changing the economics of traditional labor-based outsourcing by reducing the number of FTEs required for selected processes while increasing demand for higher-value integration, governance, analytics, and transformation services. Our analysis indicates that this is creating a two-speed competitive market: commoditized, labor-intensive services face pricing pressure, while providers with differentiated technology and transformation capabilities are gaining greater scope within client accounts.
In our view, the most significant competitive shift is from “people-at-scale” outsourcing toward “technology-enabled outcomes.” Providers that can demonstrate measurable improvements in cost-to-serve, automation rates, turnaround time, customer experience, application performance, or operational resilience are better positioned to defend pricing and expand contract scope. Our assessment is that competitive differentiation will increasingly depend on the ability to migrate customers from discrete projects or FTE-based contracts into multi-year managed services, outcome-based engagements, and integrated transformation programs. This favors providers with broad portfolios and deep enterprise relationships, but also creates openings for specialist firms that can outperform larger competitors in areas such as AI engineering, analytics, digital experience, cybersecurity, industry-specific BPO, and complex engineering services.
Which Providers are Best Positioned to Capture the Next Wave of Outsourcing Demand?
The competitive field spans global technology-service providers, business-process specialists, infrastructure operators, customer-experience platforms, engineering firms, and digitally focused challengers. The leading provider universe includes companies with annual revenues ranging from approximately USD 1 billion to more than USD 70 billion, while delivery footprints range from highly specialized regional networks to operations spanning dozens of countries. Several large providers also employ more than 200,000 people, highlighting the scale advantage available in global delivery, account management, and multi-service contracts. However, revenue scale does not directly translate into outsourcing competitiveness: differences in service mix, offshore exposure, managed-services penetration, vertical specialization, automation capability, and customer concentration materially influence each provider's ability to win and expand contracts.
Our analysis indicates that competitive positioning is increasingly separating into distinct provider archetypes rather than following a simple size-based hierarchy. Global integrated providers are advantaged in large transformation and multi-tower outsourcing contracts, while infrastructure specialists benefit from complex hybrid environments and modernization requirements. Business-process and knowledge specialists are better positioned in analytics-intensive and industry-specific workflows, whereas customer-experience providers compete through automation, multilingual delivery, digital channels, and workforce optimization. Our assessment is that AI adoption is reinforcing these differences: providers able to convert automation into measurable reductions in processing time, cost per transaction, FTE requirements, or service-level improvements have a stronger basis for defending margins and expanding contract scope than providers dependent primarily on labor arbitrage.
In our view, the key strategic question is not which provider has the largest workforce, but which providers can translate scale into higher-value, technology-enabled revenue. Providers with broad enterprise relationships can cross-sell cloud, cybersecurity, data, engineering, and managed services, while specialists can exploit capability gaps that larger competitors may address less efficiently. This creates different competitive pathways: scale leaders can deepen wallet share, specialists can command premium positioning in complex niches, and emerging challengers can gain share through faster AI deployment, flexible delivery models, or sharper vertical expertise. The principal risk for traditional FTE-based providers is that AI-led productivity gains may compress billable headcount and pricing unless contracts are redesigned around outcomes and higher-value services.
Which Companies are Capturing the Largest Market Shares, and What is Driving Their Competitive Ranking?
Market share and competitive ranking provide a clearer view of how revenue, customer relationships, product breadth, geographic reach, and operational capabilities are distributed across the market. Rather than treating market share as a standalone metric, the analysis evaluates the relative position of leading participants based on measurable indicators such as revenue contribution, product or service coverage, regional presence, customer mix, capacity, and competitive reach.
Our analysis indicates that competitive leadership is likely to remain concentrated among companies with broader portfolios, stronger distribution networks, differentiated capabilities, and the ability to serve high-value customer segments. At the same time, differences in market positioning can reveal where smaller or specialized participants are gaining ground, particularly where product innovation, cost efficiency, geographic specialization, or targeted customer offerings provide an advantage.
In our view, the most important implication is that market share rankings should be assessed alongside the underlying capabilities supporting them. A company with a leading position but limited exposure to faster-growing applications or regions may face a different outlook from a smaller competitor expanding rapidly in emerging segments. This makes changes in ranking, share movement, and competitive positioning important indicators of where future opportunities and pressure points may emerge.
Which Competitive Capabilities Separate Market Leaders from Fast-Growing Challengers?
Competitive benchmarking evaluates participants across measurable dimensions such as market share, revenue position, product and application coverage, geographic reach, pricing, distribution strength, capacity, technology capabilities, and customer exposure. Comparing these indicators reveals whether competitive advantage is primarily driven by scale, portfolio breadth, cost position, innovation, regional presence, or specialization rather than by market share alone.
Our analysis indicates that companies with stronger performance across multiple competitive dimensions are better positioned to defend their market positions, while challengers can gain ground by outperforming incumbents in targeted applications, underserved geographies, product differentiation, or cost efficiency. The comparison also helps distinguish established scale advantages from capabilities that are translating into faster competitive gains.
In our view, the most significant implication is that competitive position should be assessed through a combination of current performance and capability depth. A participant with a smaller market share but stronger exposure to attractive applications or faster-growing regions may represent a more significant competitive threat than its current ranking suggests. This creates opportunities for companies to identify capability gaps, prioritize investment areas, and benchmark their position against relevant peers.
Key Strategic Questions Addressed
- How large is the global Outsourcing Services Market in 2026?
- Which outsourcing service categories generate the largest revenue pools?
- How quickly will AI-enabled outsourcing expand through 2030-2031?
- Which regions are the largest outsourcing demand centers?
- Which countries offer the strongest delivery-cost and talent advantages?
- How are FTE-based pricing models evolving toward outcome-based contracts?
- Where are the largest demand-supply gaps in skilled outsourcing talent?
- Which industries have the highest outsourcing penetration?
- How is generative and agentic AI changing provider economics?
- Which providers hold the strongest positions across IT, BPO, KPO, and managed services?
- How concentrated is the global outsourcing provider market?
- Which companies are gaining strategic advantage through AI, cloud, and analytics?
- Which M&A themes will reshape the provider landscape?
- Where are the highest-value geographic and application white spaces?
- Which outsourcing business models are best positioned to capture the next generation of industry growth?
Outsourcing Services Market Segments
By Company Type
- Global Market Leaders
- Regional Leaders
- Mid-Sized Players
- Emerging / Niche Players
By Competitive Position
- Market Leaders
- Challengers
- Followers
- Emerging Competitors
By Benchmarking Parameter
- Market Share
- Revenue
- Product Portfolio
- Pricing
- Geographic Presence
- Distribution Network
- Technology Capability
- Manufacturing Capacity
- R&D Investment
- Customer Base
By Product / Service
- Core Products
- Premium Products
- Value / Economy Products
- Specialized / Customized Products
By Application
- Healthcare
- Automotive
- Industrial
- Consumer
- Electronics
- Other Applications
By Competitive Strategy
- Product Innovation
- Cost Leadership
- Geographic Expansion
- Strategic Partnerships
- M&A
- Vertical Integration
- Capacity Expansion
By Region
- North America
- Europe
- Asia Pacific
- Latin America
- Middle East & Africa
For inquiries regarding discounts, bulk purchases, or customization requests, please contact us at sales@precedenceresearch.com
Frequently Asked Questions





Ask For Sample
No cookie-cutter, only authentic analysis – take the 1st step to become a Precedence Research client
 Get a Sample




 sales@precedenceresearch.com
 Schedule a Meeting