Smart Water Management Market Size, Companies, Share, Patient Volume, Treatment Adoption Rates, Pricing Analysis, Regulatory Landscape, Competitive Positioning, and Demand Forecast
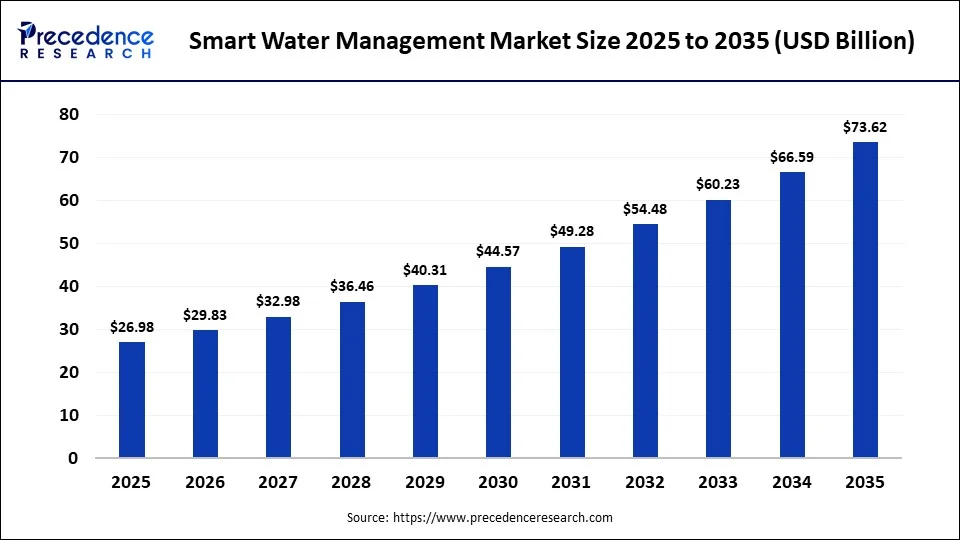
The global smart water management market was valued at USD 26.98 billion in 2025 and is projected to reach USD 73.63 billion by 2035, driven by growing adoption of connected technologies across water infrastructure. According to our primary researcher, Gautam Mahajan, an expert in water infrastructure and digital utility technologies, the market is evolving toward more connected and data-driven water management.
Source: https://www.precedenceresearch.com/smart-water-management-market
 Get a Sample
 Table Of Content


Smart Water Management Market Size and Forecast 2025 to 2035
Smart water management is evolving as utilities and other water-sector organizations invest in connected technologies to improve visibility across increasingly complex networks. Water scarcity, aging distribution infrastructure, non-revenue water losses, and conservation requirements are supporting demand for smart meters, IoT sensors, SCADA systems, cloud platforms, and advanced analytics. These technologies enable organizations to monitor network conditions more closely, identify inefficiencies, and support more informed operational decisions. The global smart water management market was estimated to be USD 26.98 billion in 2025 and is expected to grow at a CAGR of 10.56% over the forecast period, reaching USD 73.63 billion by 2035.
Key Takeaways
- By end user, the municipal water utilities segment led the market with a 42% share in 2025.
- By communication technology, the cellular segment captured a major revenue share of 28% in 2025.
- By deployment mode, the cloud segment captured the largest smart water management market share of 54% in 2025.
Market Sizing & Core Statistics
Smart Water Management Market Size, 2025-2035
The market was valued at USD 29.83 billion in 2026 and is projected to reach approximately USD 73.63 billion by 2035, reflecting a 10.56% CAGR and a 2.7x expansion over the period. The forecast points to continued digital adoption across water utilities, particularly in connected monitoring, automated operations, and predictive analytics as utilities modernize existing infrastructure.
Key Insight: The reported 10.56% CAGR and 2.7x expansion from 2025 to 2035 point to continued investment in the digitalisation of water infrastructure. Demand is extending beyond basic connectivity and measurement toward analytics, network optimization, and asset-management applications.
Source: Precedence Research Database
Recent Developments
May 1, 2026 Badger Meter: Completed acquisition of UDlive Limited
- What Happened: The acquisition of UDlive Limited by Badger Meter extended its sewer-line and lift-station monitoring capabilities through its BlueEdge brand, “beyond the meter”, solutions portfolio.
- Why It Matters: The acquisition adds to Badger Meter's addressable market by moving beyond water metering to the monitoring of water networks, which is becoming a bigger piece of the smart water management puzzle.
- Business Impact: The shift reflects a trend by longstanding metering companies to venture beyond the traditional replacement cycle and into related markets like leak detection and wastewater monitoring.
Source: Badger Meter, Inc. SEC Form 8-K, 2026
February 10, 2026 Xylem: Reported record FY2025 revenue following early integration of $7.5B Evoqua acquisition
- What Happened: Xylem had a record full-year 2025 revenue and completed the integration of its $7.5 billion Evoqua Water Technologies acquisition 18 months early. The company also gave a guarded outlook for 2026, triggering a down day in its share price.
- Why It Matters: The development illustrated that despite mixed short-term market demand, one of the sector's biggest acquisitions is moving forward from an integration standpoint.
- Business Impact: The deal will help drive the water technology scale consolidation trend. Xylem's smart infrastructure and analytics with Evoqua's treatment technologies results in a wider platform that spans across the water value chain.
Source: Xylem Inc. FY2025 earnings release, reported February 10-11, 2026
May 2025 Veolia: Acquired remaining 30% stake in Water Technologies and Solutions (WT&S) from CDPQ for $1.75 billion
- What Happened: Veolia paid for the remaining 30% stake in its Water Technologies and Solutions division for CDPQ's $1.75 billion.
- Why It Matters: The sale boosts Veolia's control over digital water technologies, such as monitoring and digital water-grid solutions, enabling better integration into the company's core water services business.
- Business Impact: The deal confirms the wider industry trend of major water-services providers gaining full ownership of smart and digital water solutions, rather than setting up joint ventures to handle them.
Source: Veolia transaction announcement, May 2025, as reported by DataM Intelligence market research
July 2025 H2O America: Agreed to acquire Quadvest for approximately $540 million
- What Happened: H2O America bought out Quadvest, a Houston-area water company, for nearly $540 million. The deal will help expand the digital water utility operations and smart infrastructure deployment in Texas.
- Why It Matters: This acquisition will be different from a technology-vendor buy, as it's a utility-level consolidation, and smart infrastructure is one of the factors that make it an important element of the strategic decision.
- Business Impact: Smart water is becoming more and more integral to utilities' acquisition considerations as a technology, and less as technology acquired down the road from third parties.
Source: H2O America transaction announcement, July 2025, as reported by DataM Intelligence market research
February 2026 Itron: Expanded smart water metering ecosystem across North America and Asia-Pacific
- What Happened: Itron has grown its smart water metering ecosystem to North America and Asia-Pacific by combining AI-powered analytics, IoT connectivity, and comprehensive meter data management to support utility deployments.
- Why It Matters: The expansion directly tackles key utility priorities, such as billing accuracy, asset management, and minimizing non-revenue water.
- Business Impact: The development reinforces the transition from hardware to software, analytics and data-driven services, with some of the traditional meter brands becoming more of a digital water technology player.
Source: Itron ecosystem expansion announcement, February 2026, as reported in smart water meter market research
October 30, 2024 (effective December 30, 2024) U.S. EPA: Finalized the Lead and Copper Rule Improvements (LCRI)
- What Happened: The U.S. Environmental Protection Agency finalized the Lead and Copper Rule Improvements on October 30, 2024, and the Rule will be effective on December 30, 2024. Within 10 years, the regulation demands that the U.S. drinking water system locate and retire all lead and some galvanized service lines. It also reduces the lead action level from 15 to 10 parts per billion, and mandates ongoing inventory reporting until November 2027.
- Why It Matters: The rule sets a national timeframe for replacing lead service lines and mandates that utilities keep comprehensive digital records of their water assets.
- Business Impact: The rule provides a near-term opportunity for GIS, asset-management, inventory, and digital water technology solutions to help utilities respond to the new reporting and infrastructure-management needs.
Source: U.S. EPA, Lead and Copper Rule Improvements, finalized October 30, 2024, effective December 30, 2024
Smart Water Management Market Companies
| Company | Headquarters | Role in Market | Strategic Relevance |
| Xylem | Washington, D.C., US | Major/incumbent | A leading water technology firm in the field of smart infrastructure, analytics, and water treatment. The company's completed $7.5 billion Evoqua deal has resulted in a larger platform that covers much of the water value chain. |
| Badger Meter | Milwaukee, Wisconsin, US | Major/incumbent | A specialist in smart water metering and “beyond the meter” monitoring. The acquisition of UDlive gave it new capabilities for monitoring sewer and lift-stations via the BlueEdge platform. |
| Itron | Liberty Lake, Washington, US | Major/incumbent | AMI and smart-grid technology provider; actively expanding AI-powered analytics and meter data management across North America and Asia-Pacific. |
| Landis+Gyr | Cham, Switzerland | Major/incumbent | Holds an estimated ~19.6% share of the smart water meter market via advanced AMI, IoT-enabled metering, and cloud-based analytics. |
| Kamstrup | Skanderborg, Denmark | Specialist/SME | Ultrasonic smart water meter and data-management solutions provider, serving municipal and utility customers globally. |
| Neptune Technology Group | Tallassee, Alabama, US | Specialist/SME | Water metering and AMI/AMR technology provider serving North American municipal utilities. |
| Mueller Water Products | Atlanta, Georgia, US | Major/incumbent | Water infrastructure, leak detection, and pipe-condition monitoring technology for municipal water distribution networks. |
| Veolia (Water Technologies & Solutions) | Paris, France | Major/incumbent | Full water-services conglomerate with digital water grid and smart monitoring capabilities; took full ownership of its WT&S division from CDPQ in 2025. |
| Siemens | Munich, Germany | Major/incumbent | Broader industrial technology player supplying SCADA, automation, and digital infrastructure technology into the smart water grid market. |
| Honeywell | Charlotte, North Carolina, US | Major/incumbent | Building- and infrastructure-automation technology provider supplying monitoring and control systems into municipal and industrial water applications. |
Top 10 Strategic Insights
The World Loses $39 Billion of Water Value Every Year Before It Reaches a Customer
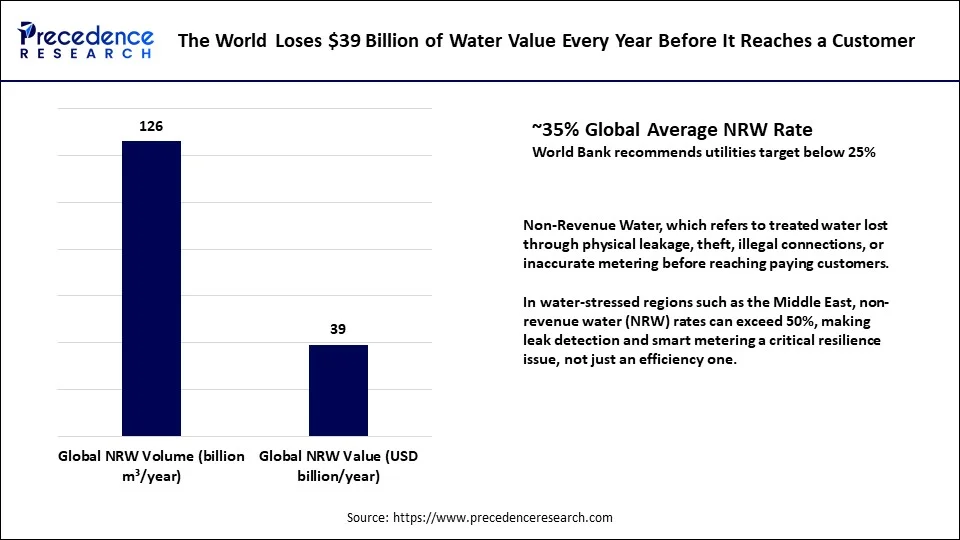
The latest estimate places the annual economic value associated with non-revenue water at USD 39 billion, with a volume of USD 126 billion cubic meters per year. The revised methodology indicates an average global non-revenue water rate of approximately 35%, compared with the World Bank-recommended level of 25%. The gap points to substantial scope for reducing water losses, supporting continued demand for smart metering, network monitoring, and leak-detection technologies.
Key Insight: With global NRW averaging 35% against the World Bank-recommended level of 25%, water-loss reduction remains a broad infrastructure priority rather than a requirement limited to a small group of underperforming utilities. The scale of NRW therefore creates a sustained market opportunity for smart metering, leak detection, and network-management technologies.
Source: Liemberger & Wyatt, "Quantifying the Global Non-Revenue Water Problem," Water Supply Journal, IWA Publishing; World Bank
North America Suffers a Water Main Break Every Two Minutes
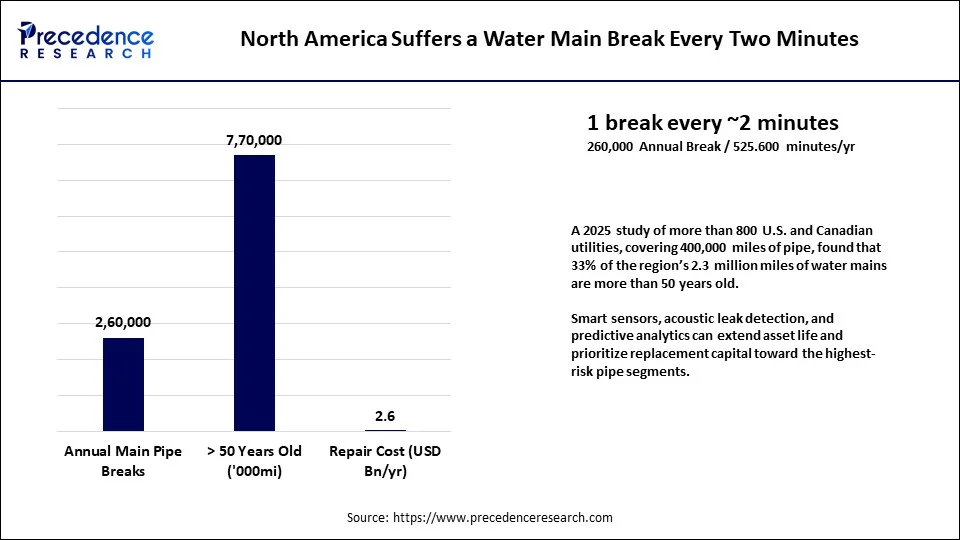
The study covering the U.S. and Canada includes more than 800 water main break utilities and approximately 400,000 miles of water main data. It reports an annual average of 260,000 water main breaks, equivalent to a break occurring somewhere in the network every two minutes. Repair costs are estimated at USD 2.6 billion annually, while 770,000 miles, or 33% of the region's 2.3 million miles of water mains, are past their useful life. T The age of the network is likely to keep condition monitoring, leak detection, and infrastructure renewal on utility investment agendas.
Key Insight: The scale of water main failures and associated repair costs points to continued pressure on North American utilities to improve network monitoring and manage aging assets. The infrastructure age profile also supports continued investment in monitoring and asset-management technologies alongside physical network renewal.
Source: Barfuss & Fugal, "Water Main Break Rates in the United States and Canada," Journal AWWA (2025), Utah State University Buried Structures Laboratory
Desalination Makes the Middle East's Water Sector Four Times More Energy-Intensive Than the West's
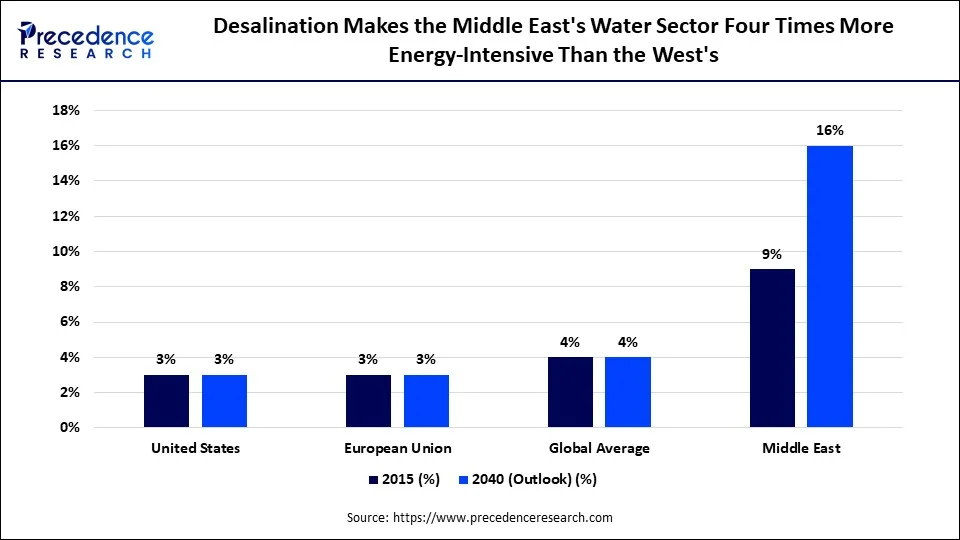
The water sector accounts for 3% of electricity use in the U.S. and the European Union, while the Middle East has a substantially higher energy requirement because of its reliance on energy-intensive desalination. The Middle East's share is projected to increase from 9% to 16% by 2040. he higher energy requirement also increases the relevance of technologies focused on pumping efficiency, network performance, and water-sector energy management.
Key Insight: The Middle East's water-sector electricity share is projected to increase from 9% to 16% by 2040, compared with 3% in the U.S. and EU. For desalination-dependent markets, the higher energy requirement increases the value of solutions that can improve operational and energy efficiency.
Source: International Energy Agency (IEA), World Energy Outlook 2016 Special Report: Water-Energy Nexus
Every Percentage Point of NRW Recovered Is Worth Roughly $50 Million to a Mid-Sized Utility
| Metric / Case | Value | Description | |
| Annual savings per 1-point NRW reduction | $50M+ | Annual savings for a utility serving 500,000 customers from each 1-percentage-point reduction in NRW | |
| Johannesburg NRW reduction | 40% - 28% | Johannesburg's NRW reduction from 2018-2023, generating an additional $120M in annual revenue | |
| Electricity required per cubic meter | 0.5-1.2 kWh | Electricity required to treat and pump one cubic meter of water, based on EPA estimates; energy associated with each water leak | |
The Johannesburg case illustrates the financial impact that NRW reduction can have at the utility level. For a utility with 500,000 customers, the cited benchmark indicates potential annual savings of over USD 50 million for each percentage point of NRW recovered. In Johannesburg, the NRW rate declined from 40% to 28% between 2018 and 2023, corresponding to USD 120 million in additional annual revenue. On a per-point basis, the Johannesburg outcome equates to roughly USD 10 million, compared with approximately USD 12 million per point under the World Bank estimate when scaled to the city's size.
Key Insight: Johannesburg example provides a useful indication of the financial benefits associated with reducing NRW. The decline from 40% to 28% was associated with USD 120 million in additional annual revenue, illustrating how improvements in water-loss management can translate into measurable financial benefits for utilities.
Source: World Bank NRW economics; BMAG Meter analysis of the City of Johannesburg case study; U.S. Environmental Protection Agency water-energy estimates
Three Global Policy Regimes Are Pushing Utilities Toward Digital Water Management
| Policy / Region | Policy Framework | Key Focus |
| European Union | Water Framework Directive 2000/60/EC | Water resource protection and management |
| United States | Safe Drinking Water Act (EPA-administered) | Drinking water quality and public health protection |
| Global/United Nations | Sustainable Development Goal 6 | Clean Water and Sanitation |
Three policy frameworks are relevant to the wider adoption of digital water-management practices. The EU Water Framework Directive 2000/60/EC establishes the European regulatory framework; the U.S. Safe Drinking Water Act provides the federal framework for public water systems; and UN Sustainable Development Goal 6 sets a global development objective for clean water and sanitation. Because these frameworks operate at different levels, compliance requirements and reporting practices vary by jurisdiction.
Key Insight: The EU Water Framework Directive, U.S. federal requirements, and UN Sustainable Development Goal 6 represent distinct policy frameworks rather than a single regulatory regime. or multinational utilities and technology providers, systems that can accommodate different monitoring, reporting, and compliance requirements may therefore have an advantage across jurisdictions.
Source: EU Water Framework Directive 2000/60/EC; U.S. Safe Drinking Water Act (EPA); UN Sustainable Development Goal 6
Digital Twins and AI Are Growing Nearly Three Times Faster Than Core IoT Connectivity
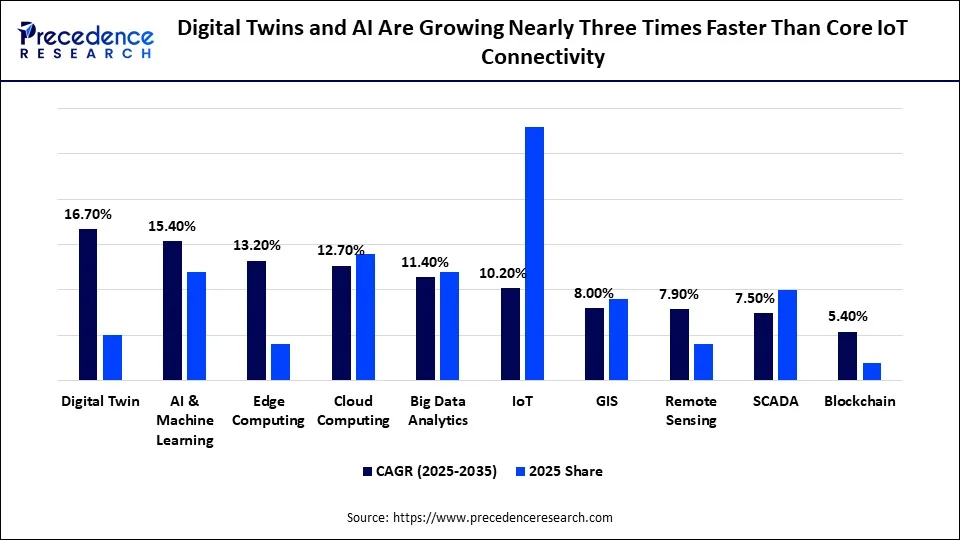
The Internet of Things remains a foundational technology layer for smart water deployments, with a projected installed share of 28% in 2025. The dataset reports an average forecast CAGR of 82% for IoT, while the broader comparison also identifies IoT growth at 10.2% a year. Digital Twin records a 16.7% CAGR and Artificial Intelligence and Machine Learning records a 15.4% CAGR. Rather than replacing the sensing layer, these technologies use data generated by connected meters and sensors for analysis and operational decision-making.
Digital Twin and Artificial Intelligence and Machine Learning represent some of the faster-growing technology categories in the dataset, with CAGRs of 16.7% and 15.4%, respectively. Their role is primarily downstream of IoT infrastructure: connected meters and sensors generate the data, while digital twins and AI/ML tools use that information for analysis, simulation, and operational decision-making.
Key Insight: IoT remains an important foundation of smart water deployments, with a 28% installed share in 2025, while Digital Twin and AI/ML show higher growth rates of 16.7% and 15.4%. The growth differential points to increasing demand for analytics, modelling, and decision-support capabilities alongside the underlying connectivity infrastructure.
Source: Precedence Research Database
Reducing Water Loss Follows a Repeatable Four-Stage Detection-to-Repair Cycle
| Stage | Process | Description |
| 1 | Detect | Acoustic sensors, pressure loggers, and flow monitoring flag anomalies consistent with a leak signature. |
| 2 | Locate | Correlation analytics and AI narrow the anomaly to a specific pipe segment or district metered area. |
| 3 | Repair | Field crews are dispatched with precise repair location data, minimizing excavation and service disruption. |
| 4 | Verify & Prevent | Post-repair monitoring confirms resolution and feeds data back into predictive maintenance models. |
This methodology describes water-loss management as a four-stage cycle. Utilities first identify anomalies through acoustic sensors, pressure loggers, and flow monitoring. Analytics and AI can then help assess the anomaly and narrow the location to a specific pipe section or district metered area. More precise location data supports targeted field intervention, reducing unnecessary excavation and service disruption.
The final stages focus on verifying the repair and monitoring the network for recurrence. Results from these activities can feed back into the detection models, creating a continuous improvement loop. Each completed detection-and-repair cycle also generates operational data that can be used to refine subsequent monitoring and prioritization.
Key Insight: The value of the four-stage approach lies in its closed-loop structure. Verification and post-repair monitoring provide data that can be incorporated into future detection and prediction, supporting progressively more targeted water-loss management.
Source: Precedence Research Database
Smart Water Platforms Stack Four Layers Between the Pipe and the Decision
| Layer | Technology / Components |
| Field Sensing Layer | Smart meters, pressure, flow, and water-quality sensors across the water network. |
| Connectivity Layer | NB-IoT, LoRaWAN, cellular, and RF mesh transmits sensor readings to the cloud. |
| Analytics & Digital Twin Layer | AI/ML models, digital twins, and GIS detects anomalies and simulates the water network. |
| Decision & Control Layer | SCADA control, utility dashboards, and customer engagement converts insights into operational decisions and actions. |
The digital water technology stack can be viewed across four layers. Field sensing includes smart meters, pressure, flow, and water-quality sensors installed across the physical network. Connectivity links these devices through NB-IoT, LoRaWAN, cellular, or RF mesh networks. Analytics and digital-twin capabilities use AI, machine learning, and GIS to identify anomalies and model network behaviour. The decision and control layer connects these outputs with SCADA systems, utility dashboards, and customer-facing tools.
Key Insight: The four layers represent distinct functions across a smart water deployment, from physical sensing and connectivity to analytics and decision-making. For technology providers, the number of layers addressed can influence the breadth of the opportunity, with analytics and decision-support capabilities positioned further downstream from basic hardware.
Source: Precedence Research Database
Regional Intelligence
Asia-Pacific Overtakes Europe as the Second-Largest Regional Market by 2035
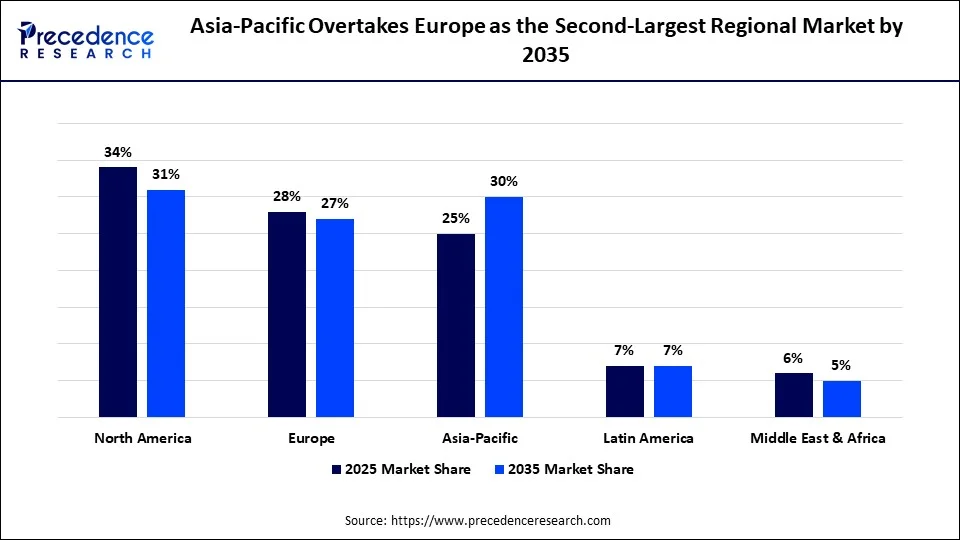
North America accounted for 34.0% of the global market in 2025 and is projected to decline to 31.0% by 2035. Europe is projected to move from 28.0% to 27.0%, while the Middle East and Africa declines from 6.0% to 5.0%. Asia-Pacific increases from 25.0% to 30.0%, while Latin America remains at 7.0% in both years. The regional mix therefore shifts toward Asia-Pacific over the forecast period.
Asia-Pacific records the largest change in regional share, increasing from 25.0% to 30.0% and moving ahead of Europe by 2035. The shift reflects the region's combination of water-management requirements, urbanisation, smart-city investment, and ongoing infrastructure development. North America remains the largest market in 2025 despite its lower projected share in 2035.
Key Insight: Asia-Pacific is the only region in the dataset showing a material increase in share, rising from 25.0% to 30.0%. The increase strengthens Asia-Pacific's position in the global market and is consistent with continued investment in water infrastructure and digital utility systems.
Source: Precedence Research Database
Asia-Pacific Grows 1.5x Faster Than the Slowest Region Through 2035
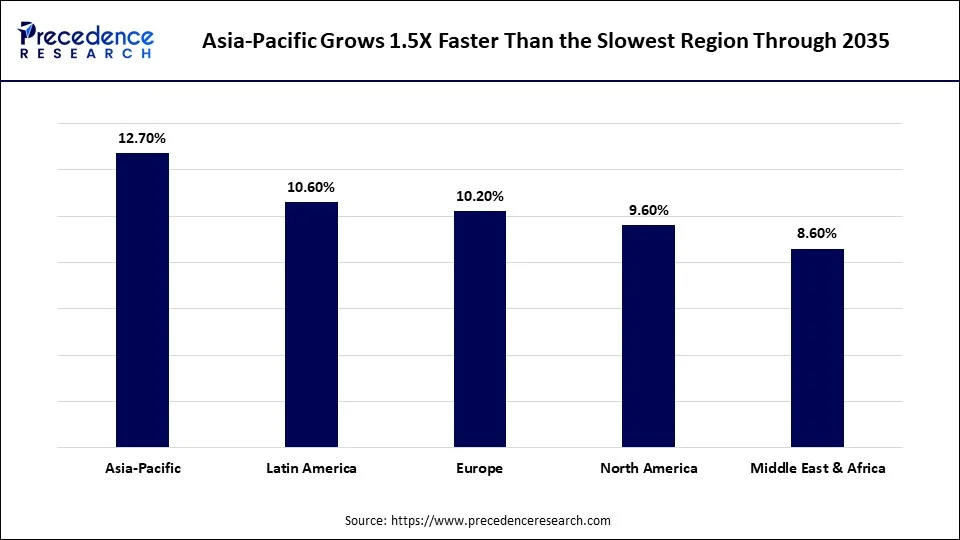
| Region | CAGR (2025-2035) | Underlying Growth Driver |
| Asia-Pacific | 12.70% | Rapid urbanization, water stress, and smart-city investment |
| Latin America | 10.60% | Water-loss reduction and municipal infrastructure modernization |
| Europe | 10.20% | Water-efficiency regulation and digital utility transformation |
| North America | 9.60% | Mature smart-meter base and utility modernization |
| Middle East & Africa | 8.60% | Water scarcity, desalination-linked infrastructure, and uneven adoption |
Asia-Pacific records the highest forecast CAGR at 12.7%, supported by water stress, smart-city investment, rapid urbanisation, and infrastructure development. Latin America follows at 10.6%, while Europe records 10.2% growth, supported by water-efficiency regulation, aging networks, and digital utility transformation. North America grows at 9.6%, reflecting the emphasis on modernisation in a more mature market, while the Middle East and Africa records 8.6%, with adoption varying considerably by country.
The regional growth pattern shows a relatively broad expansion across the market. Asia-Pacific leads at 12.7% CAGR, while the Middle East and Africa records the lowest rate at 8.6%. North America and Europe reflect more mature infrastructure environments, whereas growth in Asia-Pacific is supported by a combination of new infrastructure requirements and digitalisation.
Key Insight: All five regions record forecast growth of at least 8.6%, with Asia-Pacific leading at 12.7% and the Middle East and Africa at 8.6%. The distribution indicates that smart water management has a broad geographic growth base, although the underlying adoption drivers differ by region.
Source: Precedence Research Database
Segment Analysis
Software is Growing Faster Than Hardware as Utilities Shift Value to Analytics
| Component | 2025 Market Share | 2035 Market Share | CAGR (2025-2035) | Key Details |
| Hardware | 43.00% | 38.00% | 9.20% | Smart meters, sensors, and controllers remain the infrastructure foundation, but lose relative share. |
| Software | 35.00% | 39.00% | 11.70% | AI analytics, digital twins, GIS, and network-management platforms drive value migration. |
| Services | 22.00% | 23.00% | 11.00% | Integration, managed services, and analytics support scale with growing digital deployments. |
Hardware remains the largest segment throughout the forecast period but declines to a 38.0% share by 2035 while growing at a 9.2% CAGR. Software increases its share from 35.0% to 39.0% and records the highest CAGR at 11.7%. Services also gains slightly, moving from 22.0% to 23.0% at an 11.0% CAGR. The mix indicates increasing emphasis on software and services alongside the continued requirement for physical infrastructure.
Key Insight: The segment mix shifts toward software and services over the forecast period. Software increases from 35.0% to 39.0% while hardware declines from 43.0% to 38.0%, although hardware remains the largest category. The pattern points to a growing role for analytics and digital capabilities within smart water deployments.
Source: Precedence Research Database
Municipal Utilities Lead Today, but Industrial Water Users Are Closing the Gap
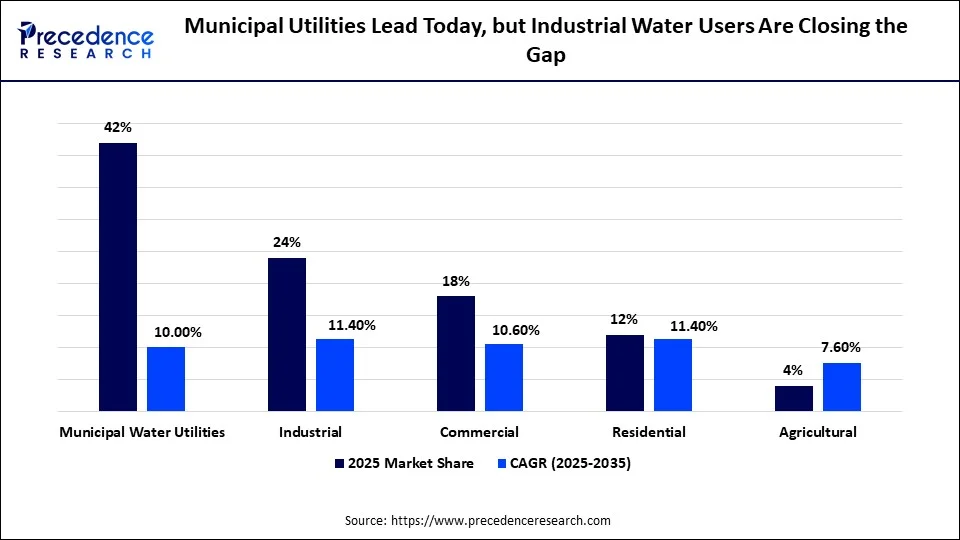
Municipal water systems represent the largest end-user category, accounting for 42.0% in 2025. Industrial users represent 24.0% and are growing at a 10.0% CAGR, while commercial and residential users account for 18.0% and 12.0%, respectively. Agricultural use remains the smallest category at 4.0% and has the lowest growth rate at 7.6%. The mix reflects different investment priorities across public, industrial, commercial, residential, and agricultural users.
Industrial adoption is supported by process-water optimisation requirements and corporate sustainability objectives, while municipal projects can face longer budget and procurement cycles. This creates a different adoption profile across the two largest end-user groups, even though municipal utilities remain the leading category by share.
Key Insight: Municipal utilities remain the largest end-user segment at 42.0%, compared with 24.0% for industrial users. Industrial demand is closely linked to process-water optimization and sustainability goals, whereas municipal adoption is more dependent on public-sector budgets, procurement cycles, and network modernization.
Source: Precedence Research Database
NB-IoT Is Overtaking RF Mesh as the Backbone of Smart Meter Connectivity
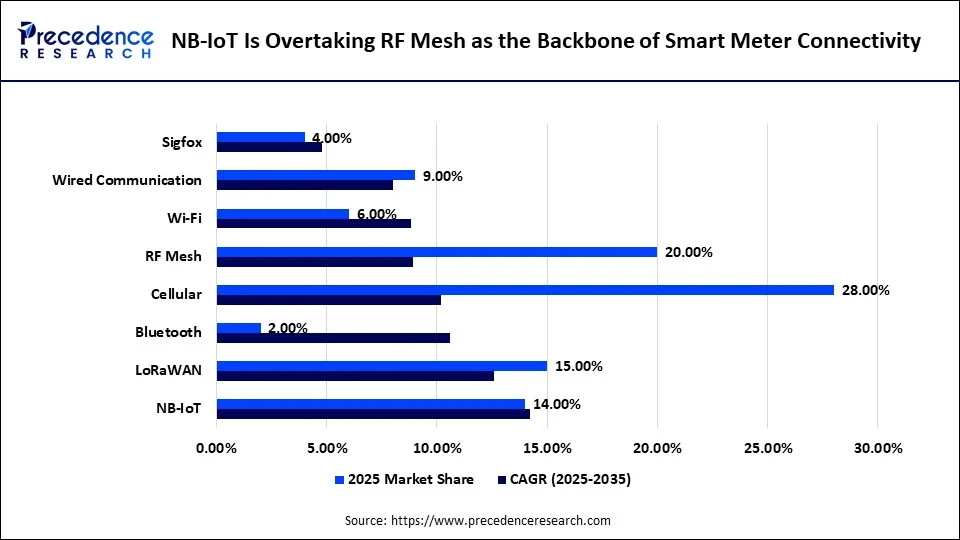
The eight communication technologies compete to provide the backbone connectivity required for smart water management systems. Cellular connectivity holds the largest share in 2025 at 28.0%, while RF Mesh accounts for 20.0%. However, growth rates indicate a changing competitive landscape, with NB-IoT recording the highest CAGR at 14.2%, followed by LoRaWAN at 12.6%, compared with the slower growth of RF Mesh.
According to our research expert, Aman Singh, the shift toward faster-growing technologies such as NB-IoT and LoRaWAN reflects the increasing demand for scalable and connected communication infrastructure across smart water networks.
Sigfox records the lowest growth rate among the communication technologies tracked, at 4.8% CAGR. NB-IoT and LoRaWAN are both open and non-proprietary technologies, a factor that can be relevant for utilities evaluating long-lived connectivity infrastructure and seeking to reduce dependence on a single vendor ecosystem.
Key Insight: RF Mesh remains a substantial installed base at 20.0%, while NB-IoT and LoRaWAN show higher growth rates of 14.2% and 12.6%, respectively. Sigfox records the lowest CAGR at 4.8%. The comparison indicates a shift in growth momentum toward newer connectivity options, although installed-base considerations remain important for utilities.
Source: Precedence Research Database
Cloud Deployment Will Command Nearly Two-Thirds of the Market by 2035
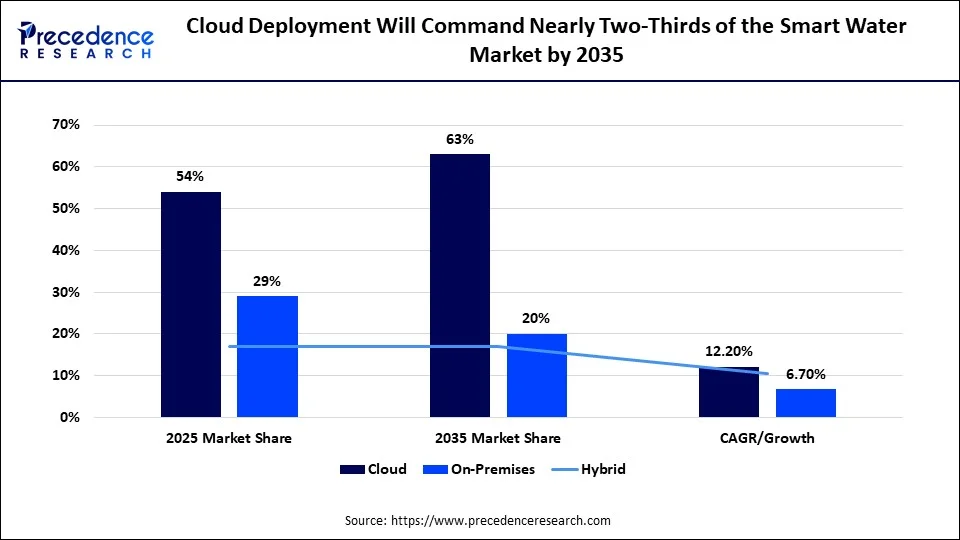
Cloud deployment accounts for 54.0% of the market in 2025 and is projected to reach 63.0% by 2035, with a 12.2% CAGR. On-premises deployment declines from 29.0% to 20.0% and records a 6.7% CAGR. Hybrid deployment remains at 17.0% in both years while growing at a 10.6% CAGR. The forecast therefore indicates a continued shift toward cloud-based deployment.
The contrast between the deployment models is most visible in the change in share. Cloud gains from 54.0% to 63.0%, while on-premises falls from 29.0% to 20.0%. Hybrid remains stable at 17.0%. This suggests that cloud adoption is increasingly serving as an alternative to legacy on-premises infrastructure rather than simply adding another deployment layer.
Key Insight: Cloud is projected to increase its share from 54.0% to 63.0% by 2035, while on-premises declines from 29.0% to 20.0%. With a 12.2% CAGR for cloud compared with 6.7% for on-premises, the forecast supports a continued migration toward cloud-based smart water platforms.
Source: Precedence Research Database
Expert Insights
The smart water management market is moving from traditional, reactive infrastructure toward more intelligent, connected, and predictive water networks. The integration of smart meters, IoT sensor monitoring, AI analytics, and automated network control is creating new opportunities for utilities to improve visibility and respond more effectively to changing network conditions. Over the coming decade, rising water scarcity, the need to improve water resource efficiency, increasing non-revenue water losses, and aging distribution systems are expected to remain key factors shaping market development.
Our experts suggest that utilities and municipalities will place greater emphasis on operational visibility, water conservation, service reliability, and real-time monitoring, alongside advanced leak detection, predictive maintenance, and integrated digital water platforms. Companies that combine scalable sensing capabilities, interoperable software, reliable analytics, and strong utility partnerships are likely to be better positioned to address the growing demand for efficient and resilient water management solutions.
Meet Our Experts
- Gautam Mahajan led the core market research activities, including methodology development, market segmentation, application analysis, competitive assessment, and market forecasting. His work provides the primary analytical foundation for the report.
- Aman Singh was responsible for collecting and validating government publications, company disclosures, technology investment data, infrastructure statistics, and other independently sourced quantitative information. His contribution strengthened the evidence base supporting the market estimates and analysis.
- Aditi Shivarkar conducted the comprehensive review and quality assessment of the research report. She verified the findings, refined the content, addressed inconsistencies, and completed the final editorial review to ensure the report was accurate, coherent, and accessible.
Smart Water Management Market Segments
By Offering
- Smart Water Meters
- Sensors & Monitoring Devices
- Advanced Metering Infrastructure (AMI)
- Automated Meter Reading (AMR)
- SCADA Systems
- Meter Data Management
- Analytics & Data Management
- Leak Detection & Monitoring
- Asset Management
- Network Management
- Digital Twin Solutions
- Water Quality Monitoring
- Smart Irrigation Management
- Professional & Managed Services
By Meter Type
- Smart Water Meters
- Ultrasonic Meters
- Electromagnetic Meters
- Mechanical Meters
- Turbine Meters
- Other Smart Meters
By Application
- Water Metering & Billing
- Leak Detection & Non-Revenue Water Management
- Water Distribution Management
- Pressure Management
- Water Quality Monitoring
- Wastewater Management
- Asset Management
- Pumping & Energy Management
- Demand Forecasting
- Smart Irrigation
- Customer Engagement
- Flood & Stormwater Management
By Region
- North America (U.S., Canada, Mexico)
- Europe (Germany, U.K., France, Italy, Spain, Netherlands, Switzerland, Rest of Europe)
- Asia-Pacific (China, Japan, India, South Korea, Australia, Singapore, Indonesia, Rest of Asia-Pacific)
- Latin America (Brazil, Argentina, Mexico, Rest of Latin America)
- Middle East & Africa (UAE, Saudi Arabia, Qatar, South Africa, Israel, Rest of Middle East & Africa)
Questions This Report Deliberately Leaves Open
- From the five regions, which one offers the most attractive risk adjusted entry opportunity - the faster growing Asia-Pacific at 12.7% CAGR or the more established North America, the largest market share and with a longer replacement cycle opportunity?
- The software is projected to grow at an annual rate of 11.7% for 2016-2020 and account for 39.0% of the total sales in 2020. What is the right way for hardware vendors to invest in R&D to not fall behind the platform vendors?
- How do you think the realistic opportunity is for converting the existing 20.0%-share RF Mesh into NB-IoT or LoRaWAN before the time of their natural replacement cycle?
- How can vendors compete with GIS and asset-management software in pricing Digital Twin Solutions that currently account for 1.5% of the market but are growing at an 18.1% CAGR?
- What is the opportunity for multi-year revenues to be generated from U.S.-specific asset-management and GIS software compliance and reporting requirements with the EPA's Lead and Copper Rule Improvements with a 10-year replacement requirement?
- Between industrial users, which have a 24.0% base and 11.4% CAGR, and residential users, which have a 12.0% base and the same 11.4% CAGR, which offers a more capital-efficient expansion opportunity for a mid-sized smart water vendor?
- What is the likelihood that vendors will be negatively impacted by the change from on-premises to cloud systems, where cloud is expected to comprise 63.0% of the infrastructure market in 2035, as opposed to 20.0% in 2022? Is this a change that warrants the end of legacy on-premises products?
- Given the documented $50M-per-NRW-point savings benchmark, what pricing models based on results or gains could enable vendors to capture more value from their customers than the traditional hardware-plus-licence pricing model?
- With the Middle East and Africa's slower CAGR of 8.6%, should vendors cut back on their investment, or will the region's high water-sector energy intensity (c. 16% of electricity consumption by 2040) call for specific energy optimisation solutions?
- With 33% of North American water mains currently over 50 years old and nearing the end of their service life, what is the realistic TAM for leak-detection technologies?
- What do companies need to do after the model of the scale to consolidate, which was followed by Xylem's $7.5 billion acquisition of Evoqua, and what mid-sized specialist companies might be seen as viable acquisition targets?
- How much more revenue is possible throughout the water meter's lifetime, as a result of the hardware, connectivity, software subscription and managed service revenues, versus the one-time revenue that's usually realized from the sale of the water meter?
- With NB-IoT and LoRaWAN both showing a 14.2% and 12.6% CAGR respectively, which technology will provide the better long-term base for a vendor's connectivity strategy, especially when faced with Sigfox's CAGR of 4.8%?
- What should be the approach for regional expansion strategies, if the vendor is to focus on the near term or the long term, and which region is the near term (North America with a 34.0% share) or the long term (Asia-Pacific with a 30.0% share)?
- What pricing, financing, and deployment models are there to address capital constraints and accelerate investment in utilities, while global non-revenue water is still around 35%?
- What is the potential of the Smart Irrigation Management segment-a 1.0% share of the market that is increasing at a 15.4% CAGR-to fend off competition from wider ag Tech players?
- As Water Technologies and Solutions is fully integrated into Veolia, what should the competitors Xylem, Badger Meter, Itron, and Landis+Gyr expect?
- What are the two or three industries that have the highest growth potential and are relatively unsaturated for new entrants in the industrial water market?
- What is the impact of the ~35% global non-revenue water rate on the creditworthiness of a municipal utility and its ability to invest in infrastructure strategically?
- Where are there opportunities to integrate water-loss reduction technologies with energy-saving solutions, especially since pumping accounts for a large portion of the energy consumption throughout the water sector?
References
- Precedence Research Database
"Smart Water Management Market Size, Segmentation, and Regional Data, 2025-2035"
https://www.precedenceresearch.com
Data used: Market size, CAGR, all segment and regional share/CAGR tables - IWA Publishing (Water Supply Journal)
"Quantifying the Global Non-Revenue Water Problem (Liemberger & Wyatt)" 2019 update
https://iwaponline.com/ws/article/19/3/831/41417/Quantifying-the-global-non-revenue-water-problem
Data used: Global NRW volume and economic value - World Bank
"What Is Non-Revenue Water? How Can We Reduce It for Better Water Service?" Accessed 2026
https://blogs.worldbank.org/en/water/what-non-revenue-water-how-can-we-reduce-it-better-water-service
Data used: Global average NRW rate and recommended target - American Water Works Association (AWWA) / Journal AWWA
"Water Main Break Rates in the United States and Canada (Barfuss & Fugal)" 2025
https://awwa.onlinelibrary.wiley.com/doi/abs/10.1002/awwa.2401
Data used: Annual water main breaks, aged-pipe mileage, repair cost - International Energy Agency (IEA)
"World Energy Outlook 2016 Special Report: Water-Energy Nexus" 2016 (regional outlook to 2040)
https://www.iea.org/reports/water-energy-nexus
Data used: Water sector electricity consumption share by region - BMAG Meter
"Non-Revenue Water (NRW): Unlocking Hidden Value in Global Water Utilities" 2026
https://www.bmagmeter.com/non-revenue-water/
Data used: Per-point NRW savings estimate; City of Johannesburg case study - European Commission
"Water Framework Directive 2000/60/EC" 2000
https://environment.ec.europa.eu/topics/water/water-framework-directive_en
Data used: EU regulatory framework reference - U.S. Environmental Protection Agency (EPA)
"Safe Drinking Water Act / Lead and Copper Rule Improvements" Finalized October 30, 2024; effective December 30, 2024
https://www.epa.gov/ground-water-and-drinking-water/lead-and-copper-rule-improvements
Data used: U.S. regulatory framework reference; recent development - United Nations
"Sustainable Development Goal 6: Clean Water and Sanitation" Ongoing
https://sdgs.un.org/goals/goal6
Data used: Global policy framework reference - Badger Meter, Inc.
"SEC Form 8-K UDlive Limited Acquisition Completion" 2026
https://www.sec.gov/Archives/edgar/data/0000009092/000119312526311374/bmi-ex99_pressrelease.htm
Data used: Recent development: M&A - Xylem Inc.
"FY2025 Earnings Release and Evoqua Integration Update" February 10-11, 2026
https://markets.financialcontent.com/stocks/article/finterra-2026-2-11-water-powerhouse-at-a-crossroads-a-deep-dive-into-xylem-inc-xyl-in-2026
Data used: Recent development: M&A integration
For inquiries regarding discounts, bulk purchases, or customization requests, please contact us at sales@precedenceresearch.com
Frequently Asked Questions





Ask For Sample
No cookie-cutter, only authentic analysis – take the 1st step to become a Precedence Research client
 Get a Sample




 sales@precedenceresearch.com
 Schedule a Meeting