U.S. Anime Market Size is USD 3.42 Billion in 2026
U.S. Anime market (By Type: T.V., Movie, Video, Internet Distribution, Merchandising, Music, Pachinko, Live Entertainment; By Genre: Action & Adventure, Sci-Fi & Fantasy, Romance & Drama, Sports, Others) Industry Size, Share, Growth, Trends 2026 to 2035.


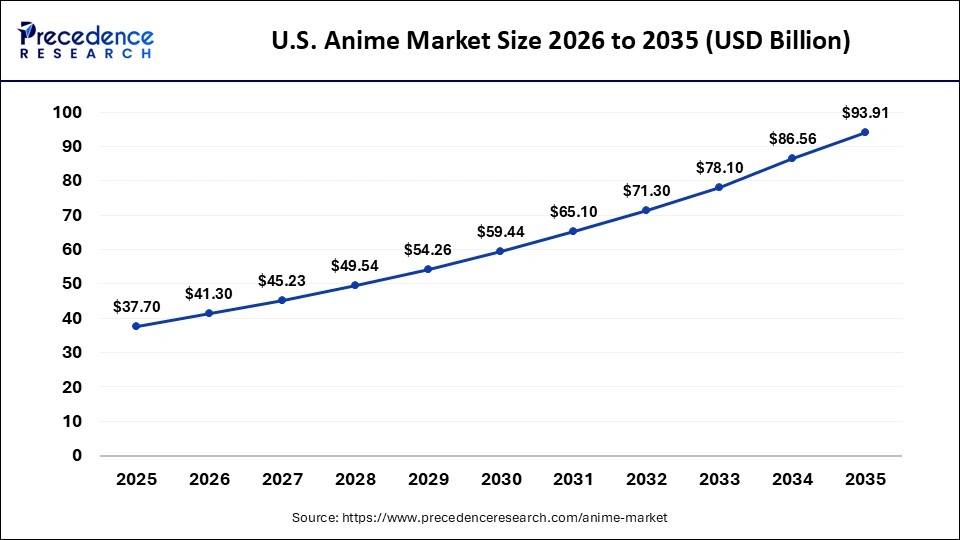
The U.S anime market size was estimated at USD 3.02 billion in 2025 and is predicted to increase from USD 3.42 billion in 2026 to approximately USD 10.34 billion by 2035, expanding at a CAGR of 13.1% from 2026 to 2035. Growing rapidly, driven by rising demand on streaming platforms, increasing appeal across all age groups, and expanding merchandise and fan events.
U.S. Anime Market Statical Scope
| Reports Attributes | Statistics |
| Market Size in 2025 | USD 3.02 Billion |
| Market Size in 2026 | USD 3.42 Billion |
| Market Size by 2035 | USD 10.34 Billion |
| CAGR 2026 to 2035 | 13.1% |
| Base Year | 2025 |
| Forecast Period | 2026 to 2035 |
Platforms like Crunchyroll and Netflix have improved accessibility, boosted audience engagement, strengthened fan loyalty, and expanded the overall expansion of any industry, particularly in the United States.
Technological advancements are enhancing both content creation and distribution. Streaming services such as Crunchyroll and Netflix leverage Artificial Intelligence and data analytics to deliver personalized recommendations, improving user engagement and retention. High-speed Internet connectivity and the rollout of 5G technology have enabled seamless high definition and 4K streaming, elevating the overall viewing experience.
Moreover, innovations in animation software, CGI, and cloud-based production tools have streamlined the creation process, allowing studios to produce high-quality anime more efficiently. This advancement, supported by insights from industry sources such as Google-based research reports, is collectively driving the evolution and expansion of the anime market across the United States.
The growing presence of anime in mainstream media and cultural events is significantly increasing its visibility and acceptance among a wider audience in the U.S., supporting industry growth. Collaborations between anime franchises and major brands in sectors like fashion and fast food are introducing the genre to new consumers. Additionally, anime conventions and festivals, featuring screenings, panels, and cosplay, offer an immersive fan experience, further strengthening engagement and driving future market expansion.
U.S Anime Market Share, By Type, 2025 (%)
| Segments | Shares (%) |
| T.V. | 12% |
| Movie | 10% |
| Video | 8% |
| Internet Distribution | 22% |
| Merchandising | 25% |
| Music | 5% |
| Pachinko | 3% |
| Live Entertainment | 15% |
- T.V.- Traditional broadcasts and fixed schedules, holding its 12% share, have limited their dominance as people are increasingly turning to on-demand streaming platforms.
- Movie- Theatrical releases are limited by 10% reach due to restricted screening windows, which struggle to match the broader accessibility offered by continuous digital distribution.
- Video- It's facing declining and unpredictable viewer habits and limited scalability, accounting for only an 8% share, diminishing its relevance in the evolving anime market .
- Internet Distribution- It's fueled by the rapid growth of streaming platforms and on-demand access, commands 22% share, and has greatly expanded the global audience reach.
- Merchandising- With a 25% share, robust fan engagement, and revenue from collectibles and branded merchandise, position this segment as a market leader.
- Music- Niche appeal, largely tied to anime soundtracks and limited standalone recognition, holds only a 5% share, restricting its broader impact in the market.
- Pachinko- With a 3% share, its focus on niche gaming integration and limited global appeal keeps it a minor player in the market.
- Live Entertainment- Events like concerts and stage adaptations draw passionate fans, and engagement captures a 15% share, yet their reliance on live, in-person formats and scalability constraints prevents them from dominating the broader market.
U.S Anime Market Share, By Genre, 2025 (%)
| Segments | Shares (%) |
| Action & Adventure | 34% |
| Sci-Fi & Fantasy | 26% |
| Romance & Drama | 18% |
| Sports | 10% |
| Others | 12% |
- Action & Adventure- Holding a 34% share, its widespread global popularity and broad audience appeal firmly establish it as the leading genre in the anime market.
- Sci-Fi & Fantasy- Rising demand for immersive storytelling and futuristic themes, accounting for a 26% share, is fueling the genre's rapid growth.
- Romance & Drama- Catering to a dedicated 18% audience base, its focus on emotional storytelling drives demand, yet it doesn't compete with the leading genres in the market.
- Sports- Despite a loyal 10% fan base and strong engagement within its niche, its limited thematic scope restricts broader market dominance.
- Others- While diverse, these less popular genres hold only a 12% share, contributing modestly to the overall market.
Top Companies in the U.S Anime Market
- Crunchyroll (Sony Pictures Entertainment Inc.)
- Discotek Media
- Sentai Film Works (AMC Networks)
- Viz Media, LLC
- Atomic Flare
- Bandai Namco Filmworks Inc.
- The Walt Disney Company
- Toei Animation Inc.
- Lionsgate Entertainment Corp.
- Eleven Arts
- Good Smile Company, Inc.
- Bioworld Merchandising, Inc.
Segments Covered in the Report
By Type
- T.V.
- Movie
- Video
- Internet Distribution
- Merchandising
- Music
- Pachinko
- Live Entertainment
By Genre
- Action & Adventure
- Sci-Fi & Fantasy
- Romance & Drama
- Sports
- Others
| Type | 2025 | 2026 | 2027 | 2028 | 2029 | 2030 | 2031 | 2032 | 2033 | 2034 | 2035 |
|---|---|---|---|---|---|---|---|---|---|---|---|
| T.V. | 0.42 | 0.47 | 0.53 | 0.59 | 0.65 | 0.73 | 0.81 | 0.90 | 1.00 | 1.12 | 1.24 |
| Movie | 0.33 | 0.37 | 0.42 | 0.47 | 0.52 | 0.59 | 0.66 | 0.74 | 0.82 | 0.92 | 1.03 |
| Video | 0.24 | 0.27 | 0.29 | 0.32 | 0.36 | 0.39 | 0.43 | 0.47 | 0.52 | 0.57 | 0.62 |
| Internet Distribution | 0.66 | 0.77 | 0.88 | 1.01 | 1.17 | 1.34 | 1.54 | 1.77 | 2.04 | 2.34 | 2.69 |
| Merchandising | 0.72 | 0.82 | 0.93 | 1.06 | 1.21 | 1.37 | 1.56 | 1.77 | 2.01 | 2.28 | 2.59 |
| Music | 0.21 | 0.24 | 0.27 | 0.31 | 0.35 | 0.39 | 0.44 | 0.50 | 0.57 | 0.64 | 0.72 |
| Pachinko | 0.15 | 0.17 | 0.19 | 0.21 | 0.24 | 0.27 | 0.30 | 0.33 | 0.37 | 0.42 | 0.47 |
| Live Entertainment | 0.27 | 0.31 | 0.35 | 0.40 | 0.45 | 0.52 | 0.59 | 0.67 | 0.76 | 0.86 | 0.98 |
| Genre | 2025 | 2026 | 2027 | 2028 | 2029 | 2030 | 2031 | 2032 | 2033 | 2034 | 2035 |
|---|---|---|---|---|---|---|---|---|---|---|---|
| Action & Adventure | 0.91 | 1.02 | 1.15 | 1.30 | 1.46 | 1.65 | 1.86 | 2.09 | 2.36 | 2.66 | 3.00 |
| Sci-Fi & Fantasy | 0.72 | 0.83 | 0.94 | 1.07 | 1.23 | 1.40 | 1.59 | 1.82 | 2.07 | 2.36 | 2.69 |
| Romance & Drama | 0.54 | 0.61 | 0.70 | 0.79 | 0.89 | 1.01 | 1.14 | 1.29 | 1.46 | 1.65 | 1.86 |
| Sports | 0.30 | 0.34 | 0.39 | 0.44 | 0.49 | 0.56 | 0.63 | 0.71 | 0.81 | 0.91 | 1.03 |
| Others | 0.54 | 0.61 | 0.69 | 0.77 | 0.87 | 0.98 | 1.10 | 1.24 | 1.39 | 1.56 | 1.76 |
Research Methodology
Related Databooks
March 2026
March 2026
April 2026
April 2026

 sales@precedenceresearch.com
 +1 804-441-9344
 Download Databook
 Schedule a Meeting