Plastic Recycling Market Size, Production Volume, Sales Performance, Export & Import Dynamics, Adoption Rates, Recycling Rate, Material Efficiency, Market Share Analysis, and Demand Trends
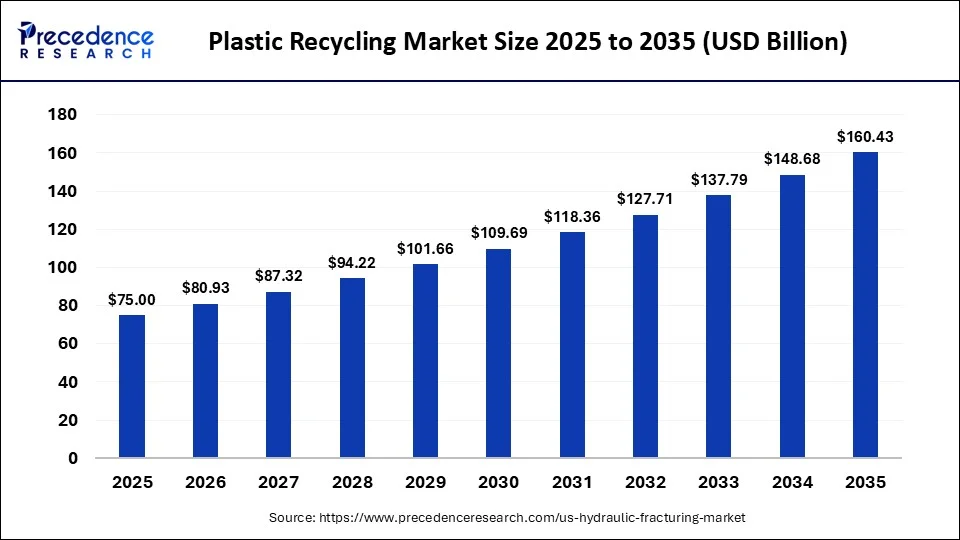
The plastic recycling market is valued at USD 75 billion in 2025 at a CAGR of 7.9%. The analysis by Vidyesh Swar, Senior Research Analyst, covers market trends, growth, and outlook. According to the research, companies that build scalable processing capacity and establish long-term relationships with downstream manufacturers should be well positioned to capture the increasing demand for reliable recycled materials. He monitored mechanical and chemical recycling adoption, recycled plastic demand, collection and sorting infrastructure, regulatory policies, and circular economy initiatives shaping the plastic recycling industry. His research serves the feasibility of recyclers, packaging manufacturers, polymer producers, and sustainability stakeholders.
Source: https://www.precedenceresearch.com/plastic-recycling-market
 Get a Sample
 Table Of Content

Plastic Recycling Market Size, Share, Trends, and Forecast Analysis
Expanding at a CAGR of 7.9% during the forecast period, the accumulation of plastic waste, stricter recycling legislation, growing recycled-content demand requirements, and increased demand for circular material supply chains are transforming the plastic recycling market. Vidyesh Swar brings combined environmental science and sustainability analysis experience of more than 5 years, and plastic recycling is moving into a more technology-driven era. He interpreted that the use of conventional mechanical recycling process technology is being replaced by advanced sorting technology, chemical recycling, and high-quality recycled polymers, which is one of the market trends. Moreover, more investments in recycling resources and recycling systems are likely to continue to drive growth in Asia-Pacific. The plastic recycling market is forecasted to expand from USD 80.93 billion in 2026 to USD 160.43 billion by 2035, growing at a CAGR of 7.9% from 2026 to 2035.
Key Takeaways
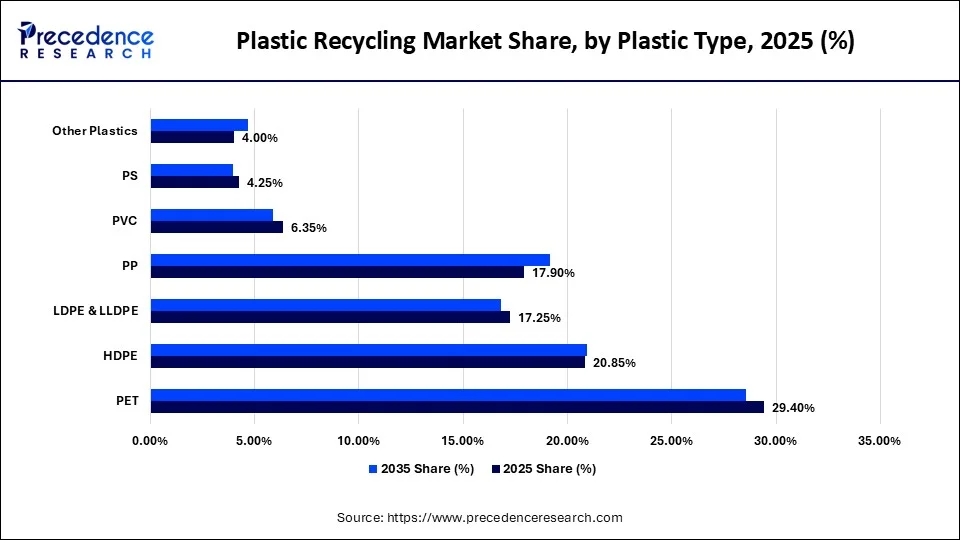
- By plastic type, the PET segment led the market with a share of 29.4% in 2025.
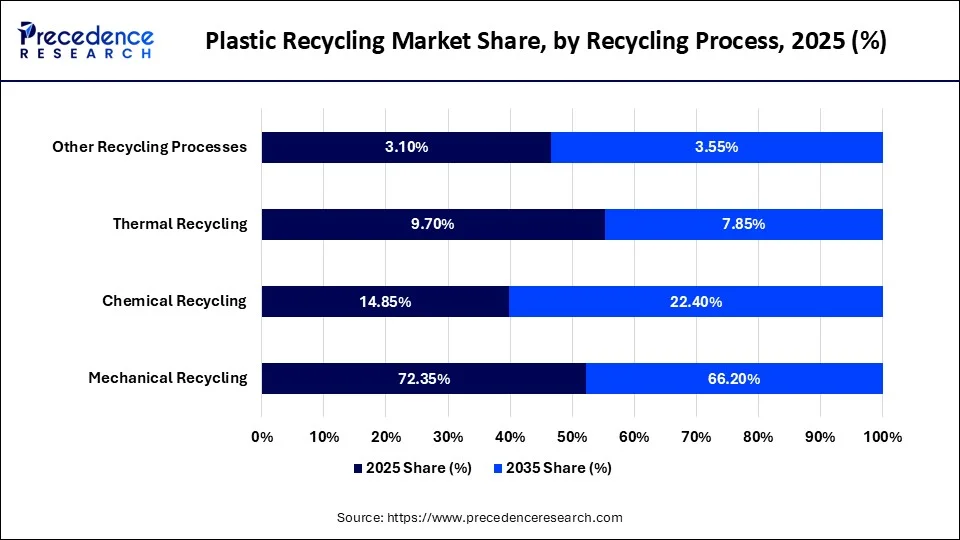
- By recycling process, the mechanical recycling segment led the market with a 72.35% share in 2025.
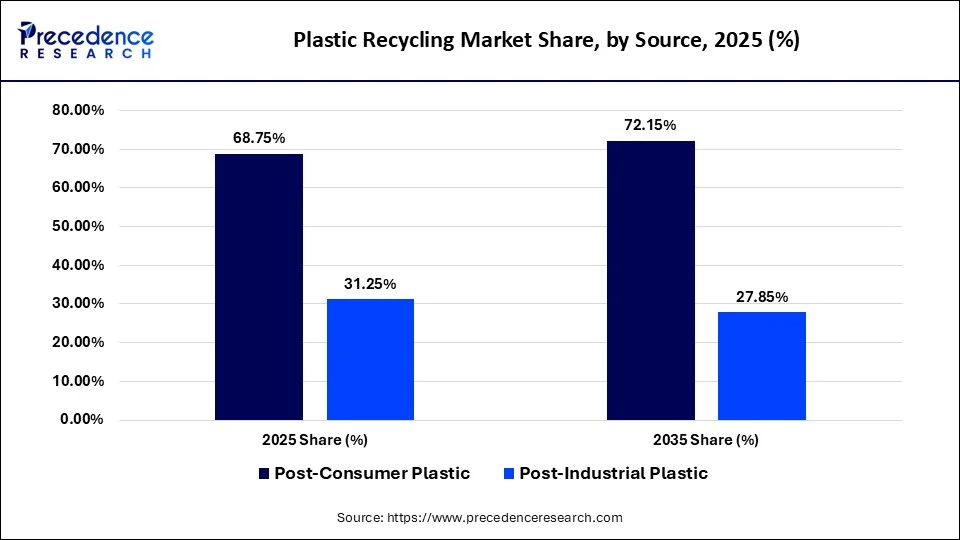
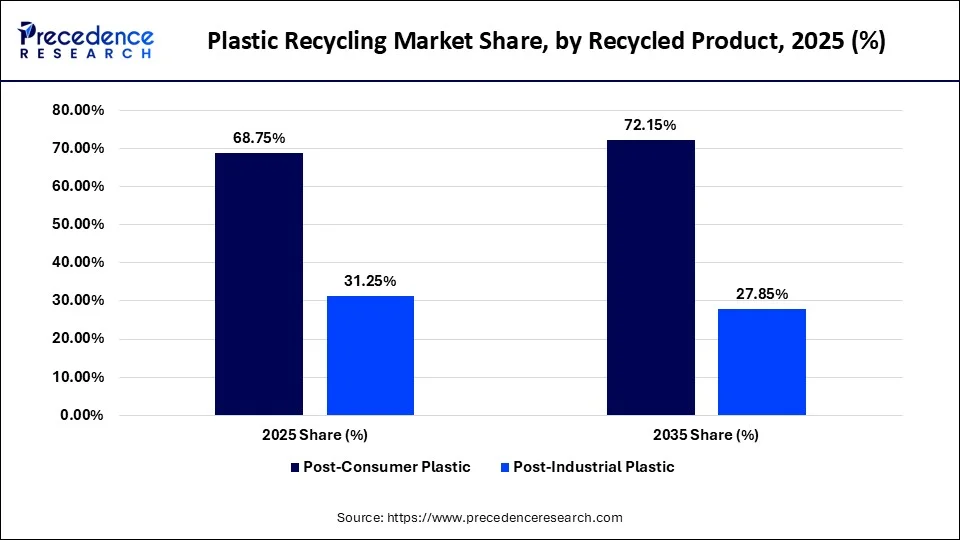
- By plastic source, the post-consumer plastic segment captured a major revenue share of 68.75% in 2025.
- By recycled product, the recycled pellets and resins segment captured the largest market share of 41.85% in 2025.
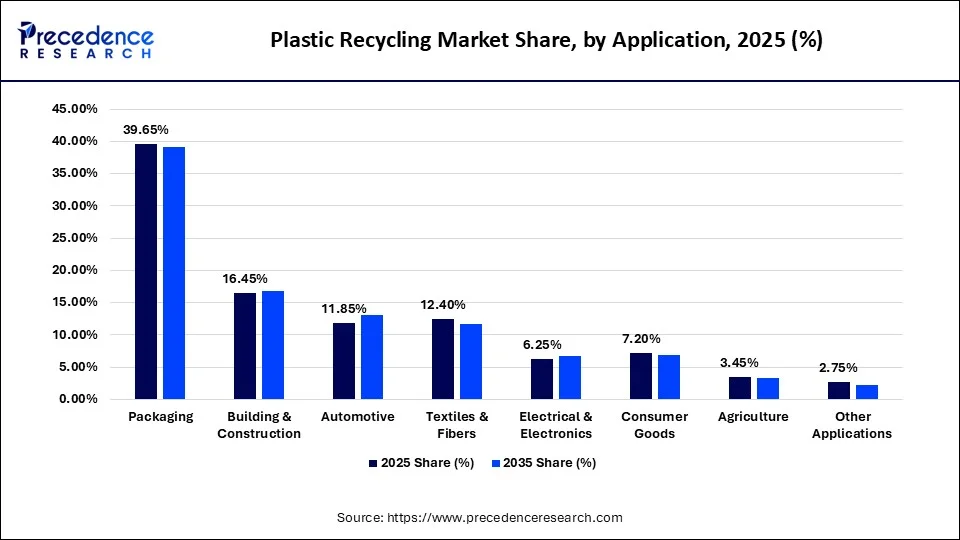
- By application, the packaging segment led the market with a share of 39.65% in 2025.
- The UK recycled 51.0% to 53.7% of plastic packaging in 2024, contributing toward a total packaging recycling commitment of 7.9 million tonnes.
- Borealis expanded its circular production capacity to 227,900 tonnes (+18% YoY) while almost doubling circular feedstock usage to 221,200 tonnes.
- Indorama Ventures has established a global PET recycling footprint with 20 facilities across 11 countries, having recycled an estimated 166 billion PET bottles.
- Indorama Ventures leads the sector with 837,000 tonnes of installed bale-input capacity and a USD 1.5 billion investment to exceed 1.5 million tonnes annually by 2030.
- Global plastic waste management has historically relied on exports, with 15.58 million tonnes of plastic waste and scrap exported in 2014.
Market Share by Plastic Type, 2025
Source: Precedence Research Database
PET is the leading segment, holding a market share of 29.40% in 2025, while modestly shrinking to 28.55% in 2035. It is increasing at 7.55% annually absolutely as a consequence of decades of investment in bottle collection infrastructure to create a mature, well-developed PET marketplace around it.
HDPE segment was the second-largest market share at 20.85%, rising to 20.95% on growth of 8.00%, and continues to benefit from rising demand for recycled rigid packaging on the household applications side of the industry. PP is really the growth leader as it rallied from 17.90% to 19.15% share with a compound annual growth rate (CAGR) of 8.65%, amid the rising share of reuse in automotive and packaging applications. This has been prompting them to raise their recycled-content goals.
Global Plastic Waste Context
| Indicator | Latest Reported Figure |
| Global plastics consumed in 2024 | >500 million tonnes |
| Global plastic waste generated in 2024 | ~400 million tonnes |
| Plastic waste recycled globally, historical OECD baseline | 9% |
| Global plastic production, 2019 | 460 million tonnes |
| Global plastic waste, 2019 | 353 million tonnes |
| Plastic waste and scrap traded internationally, 2023 | 6.04 million tonnes |
| Plastic waste and scrap trade, 2014 | 15.58 million tonnes |
Source: Precedence Research Database
According to our senior researcher, Aman Singh, more than 500 million tonnes of plastics were used, and a similar amount turned to waste in 2024. It is in perspective when considering that earlier the OECD calculated that, with processing losses taken into account, only approximately 9% of plastic waste was recycled. In 2014, 15.58 million tonnes of plastic waste & scrap were exported. In 2023, plastic waste & scrap exports dropped to 6.04 million tonnes, with the country's plastic waste importation becoming more limited as a result of the restrictions which occurred in the importing countries.
Expert Analyst View - Plastic Type
The next largest opportunity in the market is recycled rigid polymers, in particular PP, as both products offer a significant volume of consumption coupled with growing demand for recycled products. PP has plenty of room to grow further before it can keep pace with PET. That gap between PP's current infrastructure and its underlying demand is precisely what makes it the segment worth watching most closely over the next several years.
Market Share by Recycling Process, 2025
Source: Precedence Research Database
Mechanical recyclability's market share stood at 72.35% in 2025. This will maintain a respectable share in 2035 at 66.20% despite the comparatively low costs associated with older technology. Decades of proven infrastructure and the market's sluggish growth at 6.95% CAGR. It is hard to overlook the disruptive impact of chemical recycling as its share of the market grows by 22.40%. Nearly double the rate compared to mechanical recycling, with a CAGR of 12.95%, as it can handle waste streams that mechanical recycling technologies cannot and can produce a feedstock with virgin-like properties.
Mechanical vs Advanced Recycling - Real Company Indicators
| Company | Recycling Technology | Latest Capacity / Investment Indicator |
| Indorama Ventures | Mechanical PET recycling | 837,000 tonnes/year installed bale-input capacity |
| Eastman | Molecular recycling | 110,000 tonnes/year Kingsport capacity |
| Eastman | Molecular recycling expansion | ~USD2.25B planned investment across three facilities |
| Borealis | Advanced mechanical recycling | 227,900 tonnes circular production capacity in 2024 |
| Borealis | Circular feedstock | 221,200 tonnes processed in 2024 |
| LyondellBasell | Advanced chemical recycling | 50,000 tonnes/year planned Wesseling capacity |
Source: Precedence Research Database
Indonesia's Indorama Ventures has installed 837,000 tonnes per year of this technology. Eastman is choosing a different technology option, running 110,000 tonnes per year of molecular recycling capacity at its Kingsport facility. Borealis is in the middle, with 227,900 tonnes of capacity in 2024 for advanced mechanical recycling, while processing 221,200 tonnes of feedstock. That was processed in a circular fashion in the same year, indicating the company is growing both its mechanical recycling parts and production capacity.
Expert Analyst View - Recycling Process
Behind chemical recycling indicated a CAGR of 12.95%, which is indeed strategically important. On the other hand, in my opinion, this is not to suggest that chemical recycling is a substitute for mechanical recycling. Paying $2.25 billion for EASTMAN is the strongest sign yet that major producers are taking this seriously as a parallel track and not a punch in the nose to mechanical recycling's future.
Market Share by Source, 2025
Source: Precedence Research Database
The post-consumer plastic category continues to be dominated by post-consumer plastic at a 68.75% share in 2025, expected to rise to 72.15% by 2035 at an 8.45% CAGR, driven by evolving EPR programs and widespread growth in collection networks and recycled-content mandates. Further helping to increase the volume of waste in structured recycling.
Government Data - India
| Indicator | Reported Value |
| Estimated plastic waste generation, India 2021-22 | 3.902 million tonnes/year |
| Recycling capacity reported by 36 States/UTs | 935,290 tonnes/year |
| Co-processing capacity/activity | 237,119 tonnes/year |
| Karnataka share of reported plastic waste | 13.53% |
| Telangana share | 12.68% |
| Tamil Nadu share | 10.18% |
Source: Precedence Research Database
The country's central pollution-control board reported approximately 3.902 million tonnes of plastic waste generated annually in 2021-22, against the estimated generation of some 3.902 million tonnes annually. The gap indicates how much collected materials currently outnumber the material processed, even in a large and rapidly expanding market. The additional capacity from co-processing was 237,119 tonnes per year of alternative treatment. Karnataka, Telangana and Tamil Nadu were the top three generators, accounting for more than a third of the total plastic waste reported from the country.
Expert Analyst View - Source
The future growth opportunity is in post-consumer feedstock as a key element of long-term growth. This is not just the number of plastic pieces or larger percentages that are being collected. It isn't about the amount of plastic they're collecting, or the percentages in the bigger bins. Recyclers must rely on very clean and well-sorted polymer-specific material that is of predictable quality and cost. This is making collection, sorting, and pre-processing in the recycling value chain more important.
Market Share by Recycled Product, 2025
Source: Precedence Research Database
This category's largest share in 2025 is filled by recycled pellets and resins. The segment share is growing at an 8.20% CAGR from 41.85% in 2025 to 42.95% in 2035. The clear leader is that it makes it easier for customers to adapt to recycled pellets or resins than to change existing processes, where pellets and resins can be used instead of virgin polymer in the downstream manufacturing stage. The largest growth in the market is recorded for recycled sheets and films, which contribute 8.85% of market share in 2025 and are expected to increase at a 9.55% CAGR.
Expert Analyst View - Recycled Products
The industry is now making a shift from the sale of recycled waste or feedstock to specification-grade recycled polymers. This change has commercial significance since higher-quality recycled resins win better economics when they meet end-use and food contact and contamination requirements, as well as better color and melt flow properties.
Market Share by Application, 2025
Source: Precedence Research Database
Packaging holds the largest market share, at 39.65% in 2025, due to the PCR polymer market stemming from the need for recycled content being imposed on the packaging sector (CAGR 7.75% in 2025-35). Automotive's biggest mover is the application, jumping from 11.85% in 2025 to 13.15% share in 2035 for a 9.00% CAGR. The highest of any application, as vehicle manufacturers seek to raise the share of recycled materials in their products and reduce packaged vehicle weight.
Source: Precedence Research Database
The total amount of packaging waste generated in the bloc in 2023 was equal to 79.7 million tonnes, of which 19.8% was made of plastic, equalling 35.3 kg per capita. Out of that, 14.8 kilograms per person were actually recycled. That states that globally, the recycling rate for plastic packaging in the EU reached 42.1% in 2014, a 3.9% increase in the coming years. Support for recycled content continues to increase as new regulations, also coming from the EU under the Packaging and Packaging Waste Regulation. They are forcing recycled content to rise further and further in all packaging, with the target of making all packaging recyclable by 2030.
Expert Analyst View - Application
In my opinion, packaging will always be the anchor application, as it encompasses very large volumes of material usage and the direct and obviously impending regulatory burden in most of the main markets. Lower-quality recycled streams that may be hard to market in the packaging industry may be well protected for use in construction.
Market Share by Collection & Processing Stage, 2025
Source: Precedence Research Database
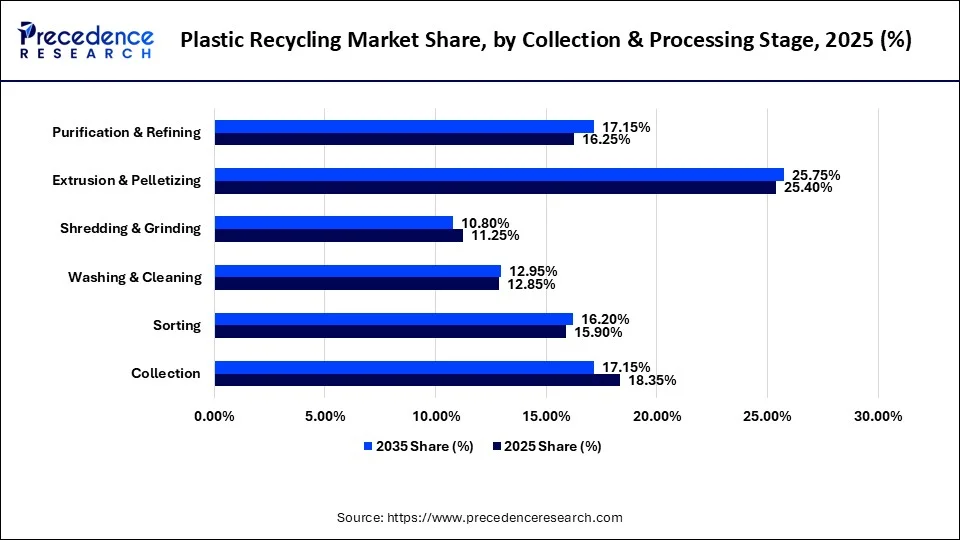
Extrusion and pelletizing is the clear leader, with a 25.40% share in 2025 to 25.75% in 2035, an increase of 8.05% CAGR. Despite the relative decline, the share of collection holding eased from 18.35% to 17.15%, with 7.15% growth in the share as the closed network of collections continued to grow. The rising demand for higher-purity recycled material and an overall trend towards advanced recycling technologies. This has driven purification and refining registration to become the fastest-growing segment of the table, with an 8.55% CAGR, from 16.25% to 17.15% material share in the market.
Over five years, the U.S. EPA Solid Waste Infrastructure for Recycling (SWIFR) program will be authorized at a total of USD 275 million for FY2022-FY2026. In the second round of funding for political subdivisions, 307 local governments applied for a total of USD 1.072 billion, and 16 governments received funding for USD 62 million.
Expert Analyst View - Collection & Processing Stage
Firmament of both ends of the chain: having a reliable supply of feedstock, combined with the ability to recycle higher-grade specification resin, is the most advantageous strategic match. Opportunities to build deeper customer relationships and differentiate increase as basic shredding becomes a commodity, while high-purity pelletizing and purification are growing opportunities.
Market Share by End User, 2025
Source: Precedence Research Database
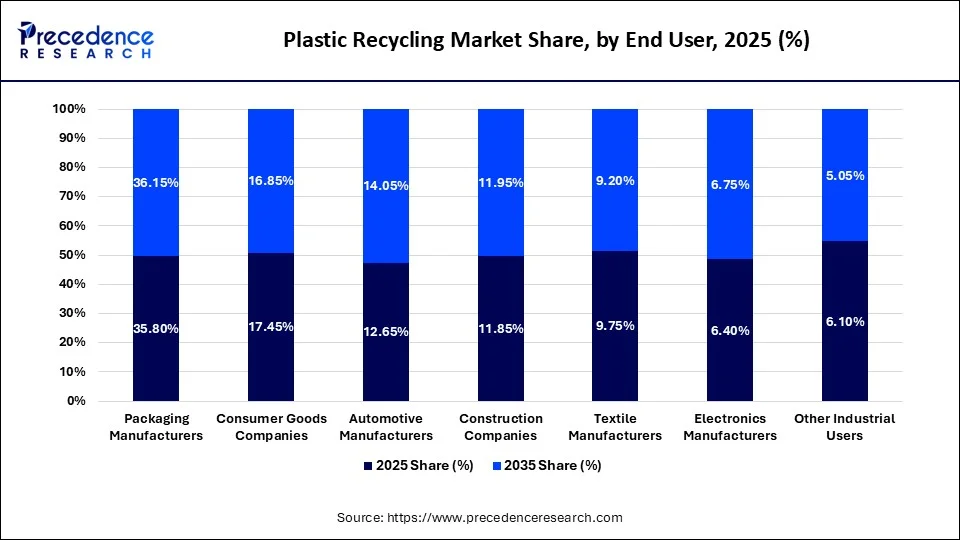
The recycled content mandates and corporate commitment to sustainable packaging are broadly the norm among large packaging companies. This will continue to drive growth for packaging manufacturers with this property, accounting for 35.80% in 2025 and further rising to 36.15% by 2035 at an 8.00% CAGR. Automotive manufacturers are the fastest-growing end-use for recycled polymers, as they increased their share from 12.65% to 14.05% at a CAGR of 9.05%, driven by both increased demand for recycled polymers as end-use and a general trend toward lightweighting of vehicles.
Buyer Demand Signals
| Buyer Group | Key Recycled Material Requirement |
| Beverage companies | Food-grade rPET |
| Packaging converters | rPET, rHDPE, rPP, recycled films |
| Consumer goods | PCR resins and certified recycled content |
| Automotive | Engineering plastics, recycled PP/ABS/polyamides. |
| Textile | rPET flakes and fibers |
| Construction | Recycled HDPE/PP/PVC products |
| Electronics | Recycled engineering polymers |
| Retail/brands | Traceable PCR and chain-of-custody data |
Source: Precedence Research Database
Food-grade rPET is in high demand by beverage companies, as only food-grade materials can pass food contact regulations. Packaging converters purchase a wider variety, including rPET, rHDPE, rPP, and recycled films depending on the product lines. Engineering plastics, such as recycled PP, ABS, and polyamides, with mechanical and thermal properties that approach those of virgin materials, are being sought after by automotive customers.
Expert Analyst View - End User
This table is all about the growth of recycled polymer grades into other applications that are not as low in value as packaging, but are durable and high-value. It highlights two distinct forms of demand from a strong growth sector, automotive, and the largest, packaging. That of volume and that of increasing technical sophistication.
Market Share by Region, 2025
Source: Precedence Research Database
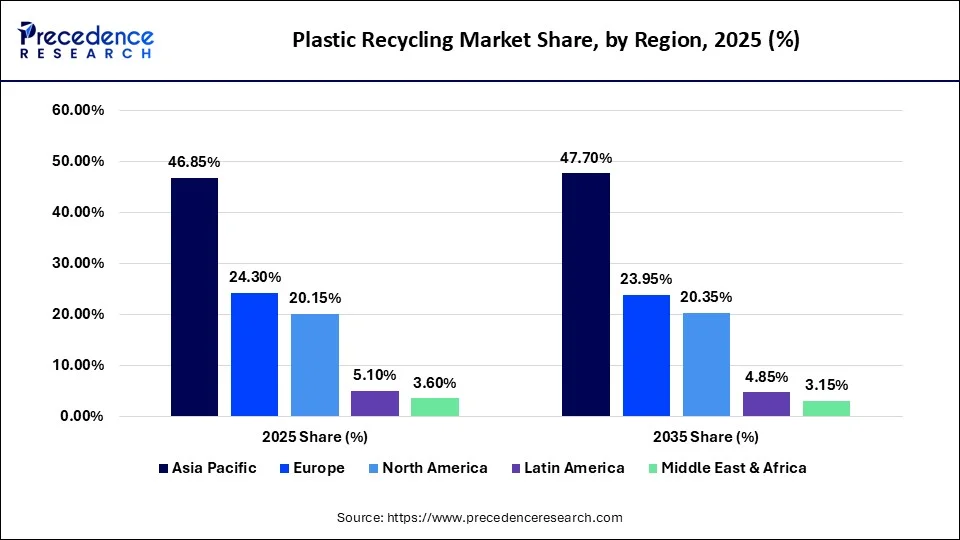
Asia Pacific holds around a 46.85% share in 2025 and is narrowing the gap to 47.70% by 2035, which is at an 8.10% CAGR, driven by an extensive plastics-processing segment and quickly developing recycling facilities in various large economies in the region. Europe's relevance mainly stems from its comparatively huge position at 24.30%, falling to 23.95% with a 7.75% growth rate as a result of being continually supported through EPR mechanisms and recycled content targets, further putting pressure on the importance of the region. North America is coming in at 20.35% expansion at 7.95% and trailing closely. North American companies are keen to increase packaging commitments and infrastructure investment in the region, which is helping to boost the region's growth rate.
Expert Analyst View - Region
North America's growth rate is most dependent on continued investment in infrastructure, being very close to the direction of Europe, where growth is more regulated, and Asia Pacific, where growth is manufacturing-led.
Regional Recycling Statistics
Europe
In 2023, the EU recycled 42.1% of the plastic packaging waste compared to 38.2% in 2013. Although some countries have amped up their recycling, others are still lagging. The disparities point to regional disparities in collection and processing infrastructure.
North America
The U.S. remains committed to developing the recycling infrastructure and investing in the program. SWIFR USD 275 million was awarded over 6 years from FY2022 – FY2026, and the second round of local-government funding elicited some USD 1.072 billion in requests.
Asia Pacific
The Asia market for plastic-processing and recycling continues to be the core of the world's plastic-processing and recycling value chain. Since China's ban on waste imports, international plastic-waste trade has shifted towards Asian destinations. In 2023, Malaysia imported 0.61 million tonnes of plastic waste, the largest amount ever captured in the OECD database.
India
The dataset for the 2021-22 CPCB reports that India generated around 3.90 million tonnes of plastic waste a year and could reportedly recycle 935,290 tonnes a year.
Major Company Recycling Capacity and Investment Data
| Company | Technology/Material | Latest Quantitative Indicator |
| Indorama Ventures | PET recycling | 837,000 tonnes/year installed bale-input capacity |
| Indorama Ventures | PET recycling | 458,500 tonnes post-consumer bale input in 2025 |
| Indorama Ventures | PET recycling | 30.57B bottles recycled in 2025 |
| Indorama Ventures | PET recycling | 166B bottles recycled since 2011 |
| Indorama Ventures | Recycling investment | USD 1.5 B committed |
| Indorama Ventures | 2030 target | 1.5M tonnes annual bale input |
| Eastman | Molecular recycling | 110,000 tonnes/year Kingsport capacity |
| Eastman | Recycling investment | ~USD2.25B across three facilities |
| Borealis | Circular production | 227,900 tonnes capacity in 2024 |
| Borealis | Circular feedstock | 221,200 tonnes processed in 2024 |
| LyondellBasell | Advanced recycling | 50,000 tonnes/year planned capacity |
| Renewi | Plastics processed | 108,000 tonnes in FY2025 |
| Renewi | Total contracted waste | 9.712M tonnes in FY2025 |
Source: Precedence Research Database
Indorama Ventures is the sector leader with 837,000 tonnes of installed bale-input capacity. This is also making a massive USD 1.5 billion commitment towards bale recycling with the target of over 1.5 million tonnes of annual bale input by 2030. Among the individual companies here, Eastman's almost 2.25 billion planned investment in three molecular-recycling plants is the largest capital investment specifically associated with chemical recycling that has been announced by any of these companies.
Expert Analyst View
These numbers reflect the industry growing on two entirely different scales, with Indorama's scale being very large. Eastman's being the scale of a company with hundreds of thousands of tonnes and an extensive molecular recycling facility, and Renewi's being the scale of a waste management business with plastics recycling being but a small component of its overall operations.
Indorama Ventures - PET Recycling Intelligence
| Indicator | 2025 / Latest |
| Recycling facilities | 2000% |
| Countries with recycling operations | 11 |
| Post-consumer PET recycled since 2011 | 3.1M tonnes |
| Bottles recycled since 2011 | 166B |
| 2025 bale input | 458,500 tonnes |
| Installed bale-input capacity | 837,000 tonnes |
| 2025 bottles recycled | 30.57B |
| 2030 annual bale-input target | 1.5M tonnes |
| 2030 bottle target | 100B/year |
| Recycling infrastructure investment | USD1.5B |
Source: Precedence Research Database
Indorama Ventures is one of the best leader of the extent to which PET recycling has scaled commercially. It does have 20 recycling facilities in 11 countries and has recycled an estimated 166 billion PET bottles. Its output of recycled bottles in 2025, at 30.57 billion bottles, was well below a theoretical recycling capacity of 357 billion bottles for the 837,000 tonne bale-input head installed.
Stating it provided a meaningful output space for expansion before investing in more capacity. The company has invested 1.5 billion dollars in recycling infrastructure. Further aiming to grow, increasing from 20 recycling sites to 24, with new facilities added in India and Nigeria, and 100 billion recycled bottles per year by 2030.
Expert Analyst View
PET is the most mature polymer in this market sector due to collection systems, bottle-to-bottle recycling, food-grade uses, and brand commitments. This have been achieved to a much greater degree with PET than with other polymers. But my interpretation of this larger opportunity would be the same circularity model in any additional category of plastics. Thus, the demand for plastics is intrinsic to the activity, but the collection and processing systems have yet to keep pace.
Eastman - Molecular Recycling Intelligence
| Indicator | Value |
| Kingsport facility capacity | 110,000 tonnes/year |
| Facility start-up | 2024 |
| 2024 plastic waste recycled | 28.4K tonnes |
| 2030 recycling target | 200K tonnes/year |
| Planned recycling investment | ~USD2.25B |
| Initial capacity of planned facilities | >110K tonnes/year each |
Source: Precedence Research Database
Eastman is growing out molecular recycling as a parallel effort to complement mechanical recycling, but not supplanting it. The site in Kingsport, opened in 2024 with an initial 110,000 tonnes per year capacity, processed 28.4 thousand tonnes of plastic waste last year and has achieved. This is called a pathway towards around 105,000 per year, which suggests it will likely reach about 130,000 per year by mid-2025.
Expert Analyst View
Mechanical recycling is most relevant in this context because it looks to chemical/molecular recycling when mechanical techniques cannot maintain polymer quality. Its competitive advantage is not just to increase the recycling quantity. Better opportunities are most likely feedstock streams that can't be cost-effective for conventional recycling to turn into high-quality polymer.
Borealis - Polyolefin Circularity Intelligence
Borealis has 227,900 tonnes of circular production capacity, an increase of 18% compared to 2023. Circular feedstock usage almost doubled to 221,200 tonnes. The company also added advanced mechanical recycling capacity with the acquisition of Integra Plastics, bringing the total to more than 20,000 tonnes.
Analyst View
Borealis emphasizes the increasing significance of recycling polyolefins, and especially PP/PE. Polyolefin recycling is not as consolidated as PET due to its split into rigid plastics, flexible plastics, and industrial waste streams. Efficient compounding, sorting, and purification become more crucial for the development of this segment, as the compounding of the compounds varies according to the application of the product.
Government and Regulatory Demand Drivers
| Policy/Program | Quantitative Indicator |
| EU plastic packaging recycling rate, 2023 | 42.10% |
| EU plastic packaging recycled per capita | 14.8 kg |
| UK plastic packaging recycled, 2024 | 1.154M tonnes |
| UK plastic packaging recycling rate, methodology 1 | 51.00% |
| UK plastic packaging recycling rate, methodology 2 | 53.70% |
| UK total packaging recycling obligation, 2024 | 7.901M tonnes |
| U.S. SWIFR funding authorization | USD275M |
| U.S. SWIFR second-round local applications | USD1.072B requested |
| U.S. second-round selected local funding | ~USD62M |
| India plastic waste generation, 2021-22 | 3.902M tonnes/year |
| India reported recycling capacity | 935,290 tonnes/year |
Source: Precedence Research Database
The UK saw recycling rates of about 51.0% and 53.7% (newer, reported-packaging methodology) for plastic packaging in 2024. The total packaging recycling commitment for the country in 2024 was 7.901 million tonnes, while a complete roll-out of the packaging EPR system was implemented in 2025. This created pressure on the demand side on top of the set recycling targets.
Expert Analyst View
Regulation is one of the most potent demand-generation mechanisms. The most important change behind it is that companies are no longer simply wanting recycled plastic. That drives recycling capacity more increasingly into the regulatory side rather than the sustainability side.
Global Plastic Recycling Policy Direction
The policy environment is shifting from sustainable commitments to products to mandatory recycled content laws and/or producer responsibility laws. The OECD has highlighted that governments around the globe are introducing recycled-content requirements. States that there has been a lack of success in voluntary commitments by companies. The lack of suitably available recycled material, especially for food contact applications, is also a significant market barrier noted by the organization.
Internationally, discussions on negotiating a legally binding instrument on plastic pollution are ongoing. The talks in August 2025 were inconclusive, and another organising meeting was held in February 2026, with substantive negotiations looking towards the next step.
Expert Analyst View
The driving force for plastic recycling market demand is regulation, becoming one of the strongest. The real change going on is that the mere desire to recycle plastic is being supplanted by the need for companies to demonstrate their recycled content, recycled performance, or producer responsibility for plastic. The evolution is beginning to bring recycling capacity more closely into line with the demands of regulation instead of just pure corporate sustainability positioning.
Buyer Intelligence - Major Buyers
| Buyer Category | Main Material Demand | Primary Purchasing Requirement |
| Packaging Manufacturers | rPET, rHDPE, rPP, recycled films | Consistent quality and regulatory compliance |
| Beverage Companies | Food-grade rPET | Bottle-to-bottle quality |
| Consumer Goods Companies | PCR resins | Traceability and recycled content |
| Automotive Manufacturers | rPP, engineering plastics | Mechanical and thermal performance |
| Textile Manufacturers | rPET flakes/fibers | Fiber quality and color |
| Construction Companies | Recycled PE/PP/PVC | Durability and cost |
| Electronics Manufacturers | Recycled engineering plastics | Reliability and purity |
| Retail / Brands | PCR packaging materials | Certification and traceability |
Source: Precedence Research Database
Few buyer types require food-grade rPET, such as beverage companies and bottle-to-bottle quality. Packaging converters source a wider range of indiscriminate materials from rPET, rHDPE, rPP, and rFilms, with the prime focus on quality and adherence to regulations. Automotive manufacturers seek distributors of recycled PP and engineering plastics that will pass mechanical and thermal performance tests. This is a growing number of automotive retailers and brand owners are looking for traceable PCR material that provides full chain-of-custody data instead of the recycled-content percentage.
Expert Analyst View
Demand for recycled plastics is growing across industries, and the demand for quality, traceability, and compliance is steadily increasing. In industries such as automotive, electronics, and construction, technical performance is still key, and sustainability is a factor in consumer purchasing decisions.
Buyer Intelligence - Procurement Criteria
| Procurement Criterion | Relative Importance |
| Polymer purity | Very High |
| Consistent quality | Very High |
| Recycled-content certification | Very High |
| Feedstock traceability | Very High |
| Food-contact compliance | Very High for packaging |
| Color consistency | High |
| Melt-flow consistency | High |
| Contamination level | High |
| Supply reliability | High |
| Price versus virgin resin | High |
| Carbon footprint | Increasing |
| Chain of custody | Increasing |
| PCR percentage | Increasing |
| Geographic supply security | Increasing |
Source: Precedence Research Database
Recycled polymer buyers are most concerned with product purity, product quality, and certified recycled content to guarantee product performance. Traceability of the feedstock and adherence to the regulatory requirements are essential for packaging and food-contact applications. Various technical parameters like colour consistency, melt-flow stability, and contamination levels have a direct impact on processing efficiency and product quality.
Further, reliable supply and cost competitiveness with virgin resin are still important considerations when selecting a source for resin procurement.
Expert Analysis View
Quality assurance, traceability, and regulatory compliance, more than price, are the main drivers for procurement decisions in the recycled plastics market. The industry is moving toward sustainable and quality-based sourcing strategies.
Buyer Intelligence - Demand by Application
| Application | Main Buyer Requirement | Commercial Opportunity |
| Food & Beverage Packaging | Food-grade PCR | Very High |
| Personal Care Packaging | High-quality PCR | High |
| Household Products | PCR resins | High |
| Automotive | Technical recycled polymers | Very High |
| Textiles | rPET fiber feedstock | High |
| Construction | Durable recycled polymers | Medium-High |
| Electronics | Engineering PCR | High |
| Agriculture | Recycled films and rigid plastics | Medium |
Source: Precedence Research Database
High-performance and certified recycled materials are most in demand as recycled polymers for food & beverage packaging and automotive applications. Other sectors, like personal care, household products, textiles, and electronics, are also key demand areas as a result of sustainability goals and circular economy efforts. On the other hand, the value of commercial opportunities continues to be strong in most sectors, as the use of recycled plastics in manufacturing and packaging continues to increase.
Expert Analyst View
The market potential for recycled polymers is highest for food & beverage packaging and automotive applications. Furthermore, demand for PCR materials in consumer and industrial applications is growing, providing significant growth opportunities for suppliers who can offer application-specific solutions and consistent quality.
Competitive Landscape
PET recycling specialists only recycle post-consumer PET waste into high-quality recycled PET for packaging, beverages, and fiber production. PET manufacturer Indorama Ventures has a robust PET recycling business with its integrated polyester and PET manufacturing base. Companies in polyolefin mechanical recycling, such as Borealis, TOMRA, Veolia, SUEZ, and Berry Global, in this segment focus on the process of sorting, washing, and re-processing PE and PP materials.
Chemical recycling is done using state-of-the-art technology for breaking plastic waste down. LyondellBasell is a company with many polymer manufacturing practices and investments in cutting-edge recycling. Its cross-cutting nature puts it at an advantage to create circular polymers and link recycled feedstock with polymer manufacturing on a large scale. Some leading brands, including Coca-Cola, PepsiCo, Unilever, Procter & Gamble, Nestlé, and packaging manufacturers, are investing in recycled plastics directly to meet sustainability goals and regulations. Their participation is driving the demand for quality recycled materials as well as fostering partnership relationships within supply chains.
Expert Overview
The competitive environment is changing from the traditional recycling business to the integrated technology-driven circular economy model. Those companies with the best recycling capacity, reliable feedstock supplies, advanced processing technologies, and existing consumer brand partnerships will have the best opportunity to capitalize on future market growth.
Expert Analyst View - Competitive Landscape
Recycling competitiveness isn't just about recycling capacity anymore. But it's rapidly becoming a function of feedstock control, technology, product qualification, and guaranteed offtake. Adopting a more integrated operating model that brings together collection activities, sorting, washing, recyclating, purifying, pelletizing, and certified PCR production. That offtake by companies for long-term supply is a course of action that large companies are already following more.
Both competitive layers are growing around chemical recycling, including the search by recyclers for commercially feasible solutions. These are suitable for plastic streams that are difficult or inefficient to process mechanically. Eastman and LyondellBasell are looking for technologies that can convert challenging plastic wastes into feedstock for making new polymers. This is not a replacement for mechanical recycling but a complementary way to achieve a better relationship.
Expert Analyst View - Buyer Intelligence
The most attractive commercial buyers over the next decade are likely to be:
- Packaging manufacturers
- Global beverage companies
- Consumer goods companies
- Automotive OEMs
- Automotive component manufacturers
- Textile producers
- Electronics manufacturers
- Construction-material producers
- Retail/private-label companies
- Chemical and polymer producers
Main Segment Snapshot
Source: Precedence Research Database
PP is among the most promising medium-term prospects with its application in rigid packaging, automotive, and industrial sectors, and the available 8.65% CAGR. The mechanical recycling method is projected to continue as the primary method for recycling PET bottles, due to its cost competitiveness and known technology. Pellets and resins will continue to be the main segment of the commercial market due to their feedability to manufacturing. Packaging will stay the largest application area, due to its significant use of plastics and regulations. Opportunities exist, though, with higher value technical applications for recycled plastics in the automotive sector, which offers higher growth potential.
Expert Insights
New players are emerging in the plastic recycling market, stating the key opportunity is to switch from the traditional waste management approach to the more circular, technology-based recovery of materials. I see the best opportunities to be found at the intersection of esoteric sorting and quality recycled polymer supply. Competitiveness will be impacted by increasing volumes of plastic waste, tougher recycling quotas, increased recycled content, and increased corporate sustainability commitments over the next ten years.
Our Experts
The primary market research process was carried out by Vidyesh Swar, Senior Research Associate, who also designed the methodology and did market segmentation, regional trend analysis, recycling technologies, competitive analysis, and forecasts, laying the foundation for the analytical part of the report.
Aman, Head of Research, has gathered and checked regulatory policies, company financial information, information on recycling capacity, production information, commodity price information, and various other quantitative information sources, which are obtained independently, thereby increasing the quality of evidence supporting calculations of the market values.
Aditi, VP Research, has validated and refined the research material, verified facts, corrected inconsistencies, and completed the research document, making it accurate and to the point.
26. Plastic Recycling Market Segments List
By Plastic Type
- PET
- HDPE
- LDPE & LLDPE
- PP
- PVC
- PS
- Other Plastics
By Recycling Process
- Mechanical Recycling
- Chemical Recycling
- Thermal Recycling
- Other Recycling Processes
By Source
- Post-Consumer Plastic
- Post-Industrial Plastic
By Product
- Recycled Pellets & Resins
- Recycled Flakes
- Recycled Powders
- Recycled Fibers
- Recycled Sheets & Films
- Other Recycled Products
By Application
- Packaging
- Building & Construction
- Automotive
- Textiles & Fibers
- Electrical & Electronics
- Consumer Goods
- Agriculture
- Other Applications
By Collection & Processing Stage
- Collection
- Sorting
- Washing & Cleaning
- Shredding & Grinding
- Extrusion & Pelletizing
- Purification & Refining
By End User
- Packaging Manufacturers
- Consumer Goods Companies
- Automotive Manufacturers
- Construction Companies
- Textile Manufacturers
- Electronics Manufacturers
- Other Industrial Users
By Region
- North America
- Europe
- Asia Pacific
- Latin America
- Middle East & Africa
For inquiries regarding discounts, bulk purchases, or customization requests, please contact us at sales@precedenceresearch.com
Frequently Asked Questions





Ask For Sample
No cookie-cutter, only authentic analysis – take the 1st step to become a Precedence Research client
 Get a Sample




 sales@precedenceresearch.com
 Schedule a Meeting