Smart Home Payments Market Revenue to Attain USD 384.61 Bn by 2033
Smart Home Payments Market Revenue and Trends 2025 to 2033
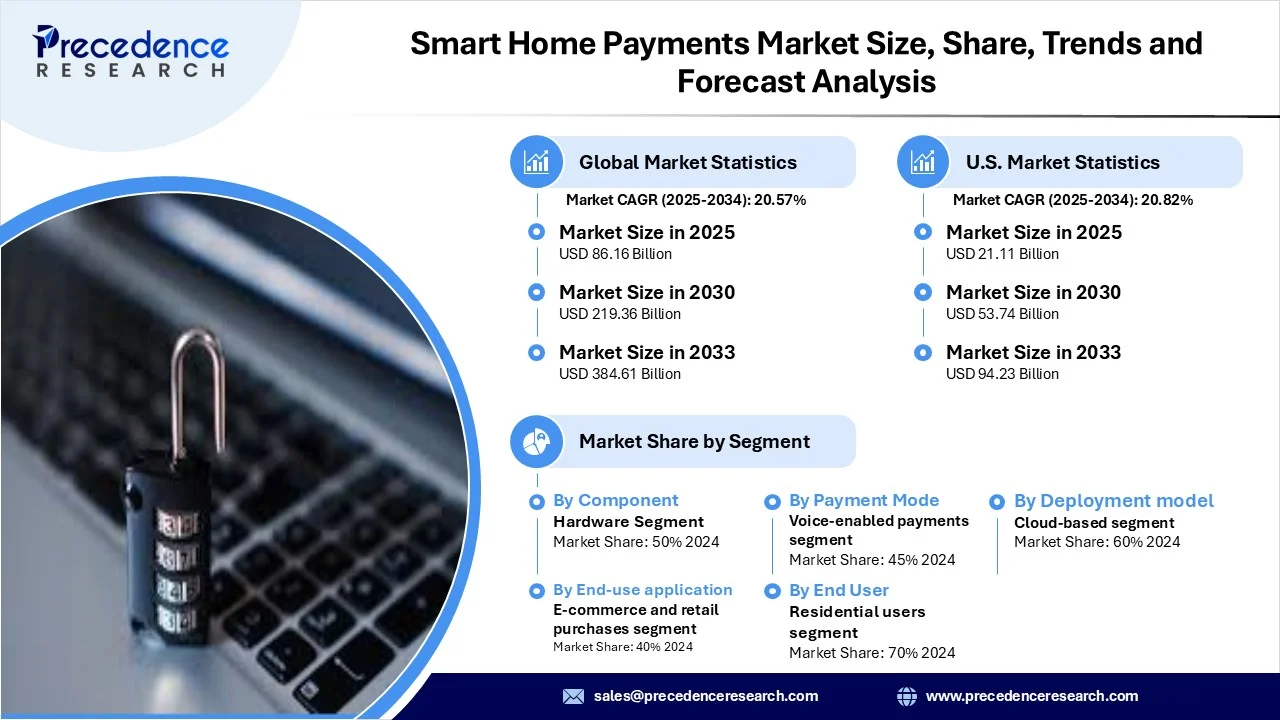
The global smart home payments market revenue reached USD 86.16 billion in 2025 and is predicted to attain around USD 384.61 billion by 2033 with a CAGR of 20.57%. Increasing adoption of smart devices, combined with consumer demand for frictionless, voice-enabled, and automated payment experiences, is driving the growth of the market.

What are the Major Factors Driving the Growth of the Smart Home Payments Market?
The market is experiencing significant growth due to technological advancements, shifting consumer preferences, and increased connectivity. The proliferation of IoT-enabled devices, including smart speakers, smart thermostats, and smart lighting, expands the number of potential payment initiation points. Furthermore, voice-enabled assistants like Amazon Alexa, Google Assistant, and Siri facilitate secure, hands-free purchases, enhancing user convenience. Finally, there is a growing consumer expectation for the integration of devices and financial services, supported by digital wallets, mobile payment platforms, and embedded payment SDKs, which streamline and secure in-device payments.
Segment Insights:
- By component, the hardware segment led the market in 2024 due to the increased adoption of devices such as smart speakers, biometric sensors, and secure payment terminals that enable seamless, contactless transactions.
- By payment mode, the voice-enabled payments segment dominated the market in 2024, as consumers often prefer voice commands for their convenience, speed, and hands-free interaction, especially in home environments.
- By deployment model, the cloud-based segment led the market with a major share in 2024. This is primarily due to its scalability, real-time processing capabilities, and seamless integration with smart home ecosystems.
- By end-use application, the e-commerce & retail purchases segment led the market in 2024 because it aligns closely with consumer behavior trends, where users increasingly prefer to shop online using voice-enabled or connected home devices.
- By end-user, the residential users segment dominated the market, holding the largest share in 2024, due to the widespread adoption of smart home devices, such as smart speakers, thermostats, and appliances, in households.
Regional Insight:
North America led the smart home payments market by capturing the largest share in 2024. This is mainly due to its early adoption of voice assistants, high internet connectivity, and consumers' embrace of smart device convenience. The U.S. and Canada's robust digital payment infrastructure and industry support minimize payment friction for consumers. The well-established digital economy also bolstered the market.
Asia Pacific is emerging as the fastest-growing market for smart home payments. This is mainly due to the rapid adoption of smartphones, broadband, and IoT devices. Countries like China, India, South Korea, and those in Southeast Asia are embracing smart home technology and cashless payments. Continuous improvements in cloud services are also supporting regional market growth.
Smart Home Payments Market Coverage
| Report Attribute | Key Statistics |
| Market Revenue in 2025 | USD 86.16 Billion |
| Market Revenue by 2033 | USD 384.61 Billion |
| CAGR from 2025 to 2033 | 20.57% |
| Quantitative Units | Revenue in USD million/billion, Volume in units |
| Largest Market | North America |
| Base Year | 2024 |
| Regions Covered | North America, Europe, Asia-Pacific, Latin America, and Middle East & Africa |
Recent Development:
- In July 2025, the National Payments Corporation of India (NPCI) is developing an IoT-ready version of UPI to enable automated payments through smart appliances, wearables, and connected vehicles. This upgrade will enable devices such as smart TVs, cars, and refrigerators to initiate payments without requiring a mobile app. Payments will be processed via a separate virtual address linked to the user’s primary UPI ID, enabling seamless embedded transactions through UPI Circle. (Source: https://www.moneycontrol.com)
Get this report to explore global market size, share, CAGR, and trends, featuring detailed segmental analysis and an insightful competitive landscape overview @ https://www.precedenceresearch.com/sample/6802
You can place an order or ask any questions, please feel free to contact at sales@precedenceresearch.com |+1 804 441 9344