Process Spectroscopy Market Size and Forecast 2025 to 2034
The global process spectroscopy market size is estimated at USD 22.98 billion in 2024 and is anticipated to reach around USD 64.66 billion by 2034, expanding at a CAGR of 10.90% between 2025 and 2034.
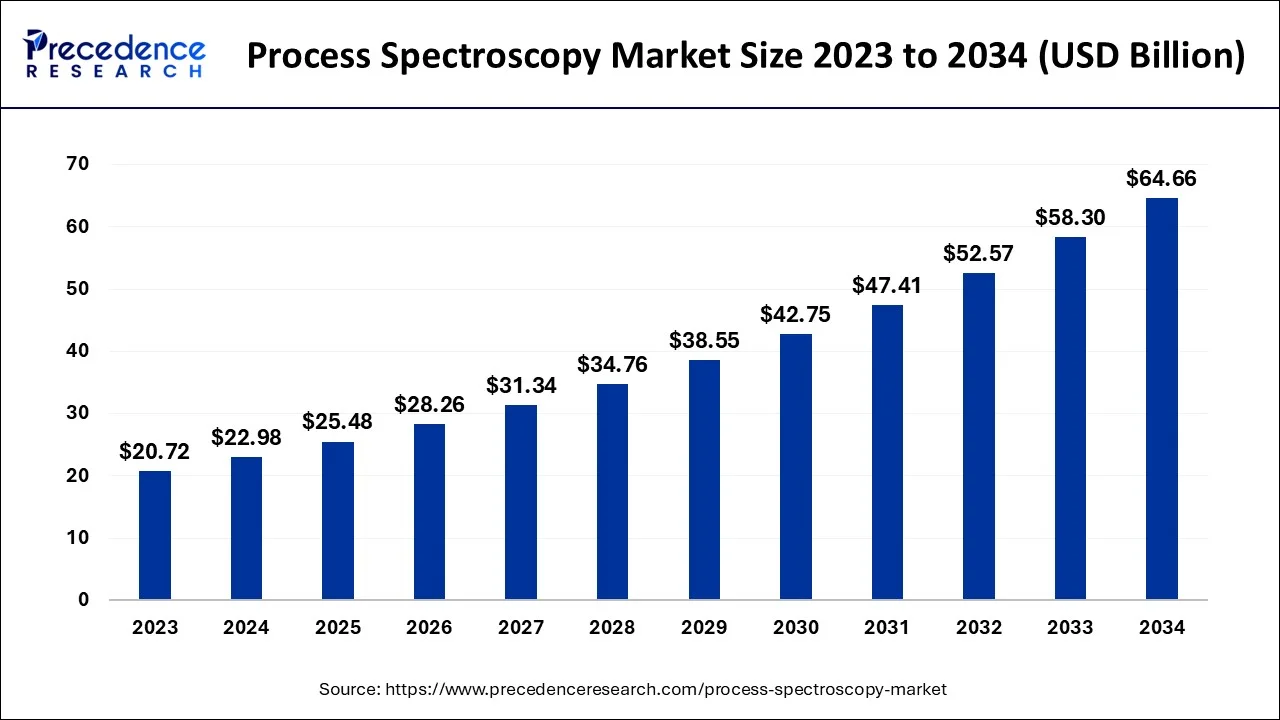
Process Spectroscopy Market Key Takeaways
- North America generated more than 45% of the revenue share in 2024.
- By technology, the molecular spectroscopy segment dominated the market and generated more than 46% of the revenue share in 2024.
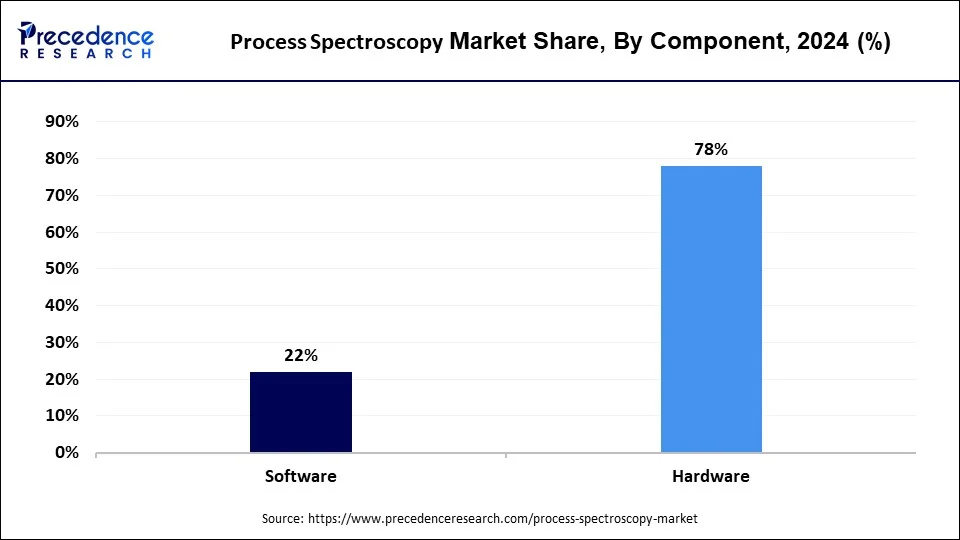
- By component, the hardware segment captured more than 78% of revenue share in 2024.
- By application, the pharmaceutical segment contributed more than 32% of revenue share in 2024.
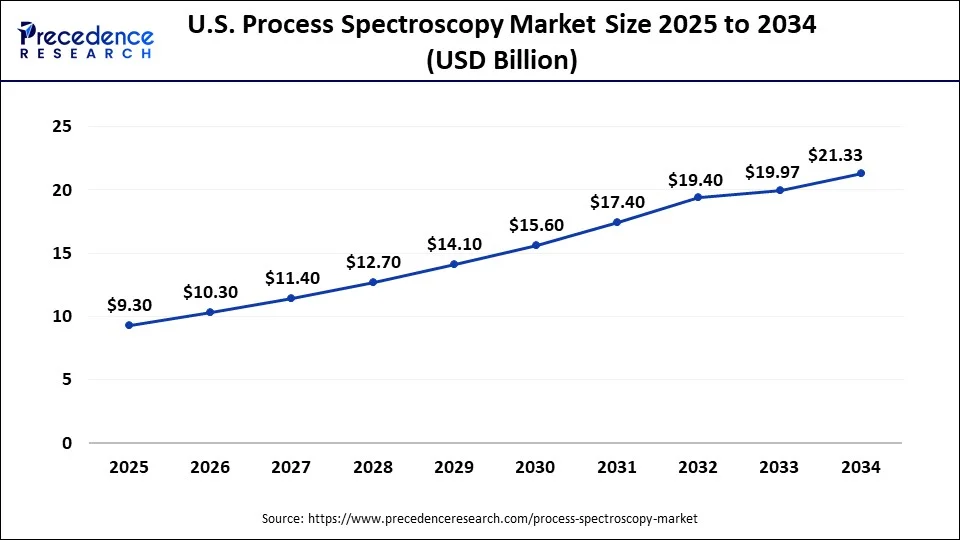
U.S. Process Spectroscopy Market Size and Growth 2025 to 2034
The U.S. process spectroscopy market size accounted for USD 7.24 billion in 2024 and is estimated to reach around USD 7.24 billion by 2034 growing at a CAGR of 11.08% from 2025 to 2034.
North America accounted for the largest revenue share of the process spectroscopy market in 2024 and is expected to dominate the market during the forecast period. The market is witnessing significant growth in North America owing to the rising production of shale gas in the U.S. and Canada. The region has the potential for investments in a variety of technical advancements and is well-equipped with the infrastructure for varied R&D across all the major industrial sectors, including food and beverage, pharmaceutical, and chemicals.
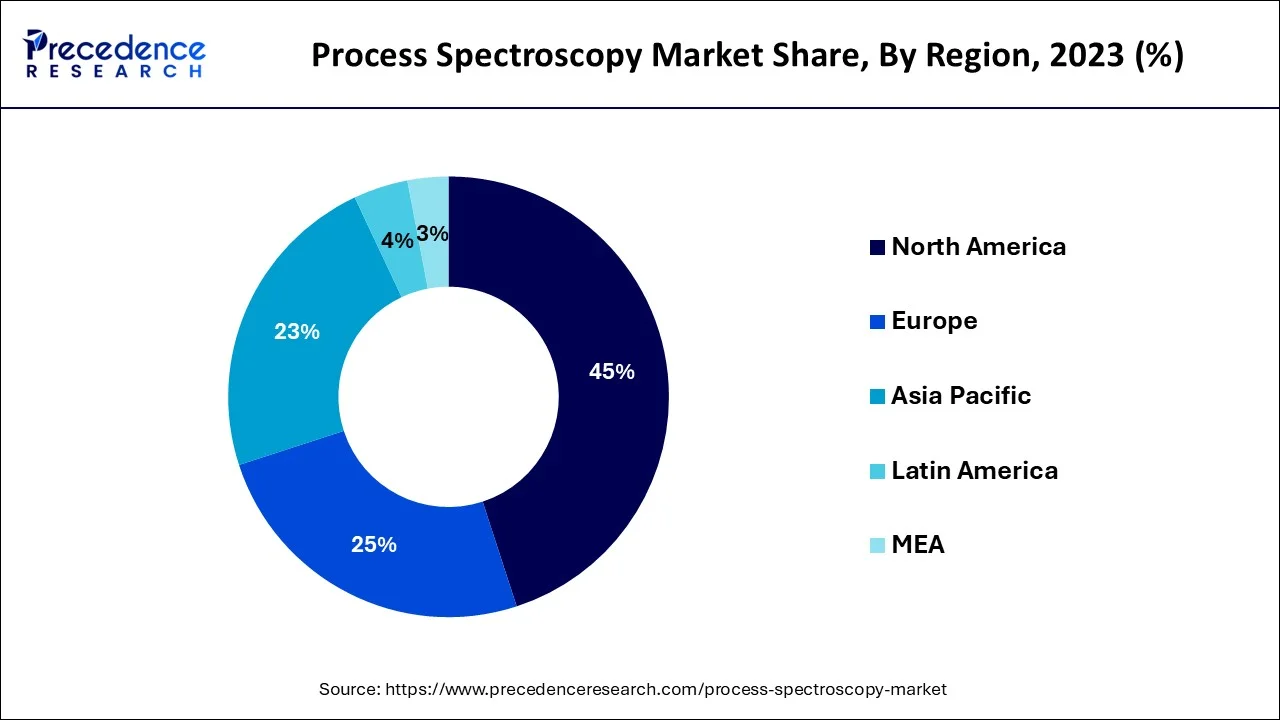
Asia Pacific is expected to have the fastest growth during the forecast period, owing to its developed R&D processes and strong manufacturing hub. The use of spectroscopic technologies for the extraction, processing, and distribution of oil and gas in these nations has led to a rise in the use of spectroscopy tools and techniques, which is fuelling the market size at a significant rate. All these variables have greatly boosted the use of spectroscopic techniques, aiding in regional development.
Market Overview
The process spectroscopy market refers to the use of spectroscopic techniques to monitor and control chemical and physical processes in various industries such as pharmaceuticals, food and beverage, oil and gas, and chemicals. Process spectroscopy involves the use of instruments such as spectrometers, sensors, and software to analyze the composition and characteristics of materials in real-time during production processes. This information is used to optimize process conditions, improve product quality, and reduce waste and energy consumption. The market for process spectroscopy is driven by the increasing demand for quality control and process optimization in various industries.
The pharmaceutical industry, in particular, has seen significant growth in the adoption of process spectroscopy due to regulatory requirements for process monitoring and control. Other factors driving the market include the increasing use of spectroscopy in food and beverage processing, the development of advanced spectrometer technologies, and the increasing focus on sustainable production practices. It has become one of the best techniques for analyzing finalized products owing to its various beneficial features. Processes that use spectroscopy can save time and money by lowering the overall cost of monitoring operations, among other things. Increasingly, process spectroscopy is being used in the medication safety process, in the demand for reliable water and wastewater treatment, and in the expansion of oil and gas process operations. Growing consumer awareness of the value of high product quality has a positive impact on the growth of the worldwide process spectroscopy market. Consequently, one of the main factors contributing to the increased use of process spectroscopy in the global market is the rising demand for products of higher quality.
Process Spectroscopy MarketGrowth Factors
- Rising focus on achieving international quality standards
- Rising focus towards avoiding variable rework and scrap costs
- Pharmaceuticals and healthcare to drive the market demand
Future Trends
- AI integration- Real-time decision making, predictive maintenance, and technologically-assisted process optimization leverage the immense power of AI-driven data analytics to make spectroscopy systems smarter and more effective.
- Biopharma adoption- In the biopharmaceutical industry, process spectroscopies are being used for nearly all real-time monitoring applications in production to support quality assurance and regulatory compliance, like PAT (Process Analytical Technology).
- Miniaturization- Smaller, portable, and mobile methods of spectroscopy analysis are now in demand to service on-site analysis, and increase applicability amongst field industries such as agriculture and environmental quality.
- Green and sustainable manufacturing- Spectroscopy assists industries in waste and emission reduction and optimization of chemical processes during production, mirroring their change towards green and sustainable manufacturing practices.
Market Scope
| Report Coverage | Details |
| Market Size by 2034 | USD 64.66 Billion |
| Market Size in 2025 | USD 25.48 Billion |
| Market Size in 2024 | USD 22.98 Billion |
| Growth Rate from 2024 to 2034 | CAGR of 10.9% |
| Largest Market | North America |
| Fastest Growing Market | Asia Pacific |
| Base Year | 2024 |
| Forecast Period | 2025 to 2034 |
| Segments Covered | Technology, Component, Application, and Region |
| Regions Covered | North America, Europe, Asia-Pacific, Latin America, and Middle East & Africa |
Market Dynamics
Drivers
Rising focus on achieving international quality standards
To satisfy international standards of quality like ISO or Six Sigma certification, several industries around the world, including pharmaceuticals, food and beverage, agriculture, pharmaceutical, and chemical are attempting to improve the quality of their product. Nowadays, there are over 162 standard groups that represent ISO in different countries. Additionally, more than 150 firms claim to have used Six Sigma frameworks for operations successfully, according to Six Sigma data.
Both production and the corporate operations of goods within an industry are subject to these certifications. High-quality packaged meals, medicines, chemicals, and agricultural seeds are becoming more and more in demand among consumers. These elements are therefore anticipated to grow the process spectroscopy market globally throughout the course of the forecast period.
Restraint
High Initial Cost
Despite growing adoption, process spectroscopy faces key restraints that limits its widespread deployment across industries. One major challenge is the high initial cost and complexity of advanced spectroscopic systems, particularly those incorporating technologies like FTIR, Raman, or mass spectroscopy. Setting up these instruments often requires a controlled environment, skilled operators, and expensive calibration standards factors that can deter small and medium sized enterprises from adoption. Additionally, integrating spectroscopy tools into existing production lines or chemical processing systems can be technically challenging, particularly in legacy infrastructure where compatibility and real time data synchronization may be limited. These barriers can slow implementation timelines and increase the total cost of ownership, making it harder for companies to justify the investment despite the long term benefits.
Rising focus towards reducing variable rework and scrap costs
The entire manufacturing process can be controlled and supervised by the product makers with the help of process spectroscopy. The raw material's quality is evaluated and tested using spectroscopy, and quality checks are carried out at each stage of production. This helps product creators analyse and predict the quality of the finished product, especially those working in the chemical, pharmaceutical, and food industries. Manufacturing is stopped at any steps where the results are unfavourable. By doing this, less scrap and rework are produced at the end of the process. Also, it shortens the time to market by lowering the cost of keeping big stockpiles. These elements are therefore anticipated to grow the process spectroscopy market globally throughout the course of the forecast period.
Rising usage of spectrometers for biopharmaceutical and life science application
To measure intracellular ion concentrations, examine molecular rotation, and precisely regulate sample temperatures for protein and peptide analysis, fluorescence spectroscopy is widely used. The market is being driven by an increase in the use of various spectroscopic technologies for a variety of life science applications. These life science applications include characterising bio-labels for live cell imaging, GPCR oligomerization, bacterial strain detection, platelet response analysis using cellular signalling, analysis of changes in protein tertiary structure, and testing thermal stability of pharmaceuticals and biocatalysts.
In order to maintain a competitive advantage in the market, major competitors in the process spectroscopy space are constantly creating cutting-edge spectrometers. For instance, in November 2021 at the American Society for Mass Spectrometry (ASMS) Symposium on Mass Spectrometry and Associated Subjects, Pennsylvania, U.S., Thermo Fisher Scientific Inc. introduced new-generation mass spectrometry instruments, procedures, and software. Orbitrap Exploris MX mass detector, which enables biopharmaceutical laboratories to adopt multi-attribute method (MAM) and perform intact analysis of monoclonal antibodies, oligonucleotide mass determination, and peptide mapping, was a component of the launched device.
Key Market Challenges
- There are following factor which can restrain the market from growing
- Huge capital investment and lack of skilled labour
- High Cost of Sterilization Pouches
Huge capital investment and lack of skilled labour
The cost of implementing process spectroscopy can be high, which can be a challenge for small and medium-sized enterprises. Manufacturers of spectroscopes demand high prices for these devices, which restricts their availability. The total cost is increased by the spectroscope's high maintenance and operational requirements. These elements are therefore anticipated to restrain the demand for process spectroscopy over the forecast period.
Professionals with the necessary education and expertise are needed to handle and operate spectroscopes. If workers lack the necessary training, it will be more expensive to supply it. Therefore, during the course of the forecast period, these factors are anticipated to restrain the expansion of the global process spectroscopy market.
Key Market Opportunities
The sterilization pouch market presents several opportunities for growth and expansion in the coming years. Here are some of the key opportunities:
- Growing demand from emerging markets
- Advancements in Packaging Technology
Growing demand from emerging markets
The market is being driven by an increase in the use of Raman spectroscopy for field hazardous chemical identification, pharmaceutical quality control, and airport security screening. Airports frequently use these spectrometers, which offer remarkable detection capabilities with a very low rate of false alarms for non-metallic containers. Raman analyzers also make it possible to quickly identify substances such as explosives, drugs, hazardous industrial chemicals, chemical warfare agents, and other substances in sealed, opaque containers. They are widely utilized in incident response and the identification of dangerous chemicals.
Due to the use of these spectroscopes in hazmat response, EOD, CBRN, law enforcement, and parcel screening at customs, ports, and borders, the market for Raman spectroscopy is expanding.
To stay competitive, major market companies are making significant investments in R&D for Raman spectrometers and releasing cutting-edge products on the market. For instance, Timegate Instruments Ltd. will introduce the PicoRaman M3, a third-generation instrument that combines actual fluorescence rejection with patented time gated raman technology, in June 2022.
The benefits of this device include its widespread use for non-destructive analysis and its ability to monitor highly specific compounds quickly and continuously in real-time online. The PicoRaman M3 spectrometer is also used in research and process sectors, such as the biopharmaceutical industry, to track bioprocesses and determine nutrients.
Development of portable and handheld devices
The development of portable and handheld devices for process spectroscopy is a significant growth opportunity. These devices would allow for real-time monitoring of processes in the field, making them ideal for applications such as environmental monitoring and food safety.
Technology Insights
The mass spectroscopy segment is expected to grow at the fastest rate in the market during the forecast period of 2025 to 2030. Mass spectroscopy is gaining rapid traction due to its high precision, sensitivity, and accuracy in identifying chemical compositions and molecular level analysis, making it increasingly valuable in high end applications across pharmaceuticals, biotechnology, environmental testing, and food safety. Technological advancements such as the integration of AI and machine learning worth mass spectrometers, along with miniaturized and portable devices, are further expanding its applicability in real time and on site testing environments. Additionally, regulatory mandates for better quality control and stringent compliance requirements in drug manufacturing and food testing are pushing industries to adopt more sophisticated analysis methods, with mass spectroscopy standing out as a preferred choice. As a result, this segment is anticipated to record the highest compound annual growth rate (CAGR) among all technology types in the coming years.
Component Insights
The hardware segment is projected during the forecast period of 2025 to 2030. While hardware has traditionally held the dominant market share, its growth is now being accelerated by the rising demand for more advanced, indicated, and miniaturized process spectroscopy instruments. Innovation in sensor design, the incorporation of wireless connectivity, and real time monitoring capabilities are making hardware solutions more attractive for industries like oil and gas, chemicals, and pharmaceuticals. Moreover, manufacturers are investing in rugged, explosion proof, and high accuracy spectroscopic hardware that can operate efficiently in extreme industrial environments. This is particularly important for in line and on line process monitoring, where reliability and precision are critical. In addition, the expanding deployment of spectroscopy hardware in developing regions fuelled by industrial automation trends and smart factory initiatives is expected to further drive hardware sales. These combined factors contribute to the segment's anticipated strong CAGR, reinforcing its position as the fastest growing component category in the process spectroscopy market.
Application Insights
The food and beverage segment is expected to grow with the highest CAGR in the market during the studied years (2025 to 2030). Growing global concerns about food quality, safety, and regulatory compliance are pushing manufacturers to adopt advanced analytical technologies such as process spectroscopy. This technique enables real time monitoring of food production processes, assuring consistency, detecting contaminants, and verifying ingrident authtencity. Additionally, increased consumer demand for clean label and minimally processed foods has promoted producers to enhance quality assurance systems. The adoption of spectroscopy in applications like moisture content analysis.
Fat/protein measurement and colour grading is becoming increasingly common. Furthermore, government regulations around food traceability and quality standards specially in regions like North America and Europe are contributing to the rapid uptake of spectroscopic systems more affordable and easier to integrate into production lines, the food and beverage segment is poised to experience the fastest growth among all end use applications in the coming years.
Process Spectroscopy Market Companies
- Yokogawa Electric Corporation
- Thermo Fisher Scientific, Inc.
- Shimadzu Corporationth
- Sartorius AG
- Kett Electric Laboratory
- Kaiser Optical Systems, Inc.
- HORIBA Ltd.
- Foss
- Danaher Corporation
- Bruker
- Agilent Technologies, Inc.
Recent Developments
- Researchers at the Centre for Nano and soft Matter Sciences (CeNS) in Bengaluru have engineered a surface enhanced Raman spectroscopy (SERS) sensor that's both highly sensitive and robust under extreme conditions. Combining reduced graphene oxide (rGO), silver nanoparticles, and cerium oxide on a glass substrate, this sensor achieves detection limits as low as 20 Nano molar for compounds such as TNT and RDX. Notably, it maintains high performance even in 90% humidity and at temperatures as low as 7?C, and can be mass produced using physical vapour deposition making it highly scalable. This technological leap opens doors for applications in security screening (e.g., airports), defence, and environmental monitoring.
(Source: Bengaluru researchers develop durable sensor to detect explosives | Bengaluru News - Times of India) - In July 2025, in a significant stride toward real time catalyst analysis, researchers at Idaho National Laboratory (INL) unveiled SpectroTAP. This pioneering technique seamlessly merges Temporal Analysis of Products (TAP) with operando spectroscopy, enabling scientists to observe catalysts during chemical reactions rather than only before or after. By introducing pulses of reactant gas simultaneously monitoring structural and compositional changes within the catalyst, SPectroTAP captures dynamic behaviour with exceptional clarity. This method promises to revolutionize catalyst design improving efficiency, extending lifespan, and reducing costs in vital industries like fuel pharmaceuticals by revealing how catalysts truly perform under operation.
(Source: Bengaluru researchers develop durable sensor to detect explosives | Bengaluru News - Times of India)
Segments Covered in the Report
By Technology
- Atomic Spectroscopy
- Mass Spectroscopy
- Molecular Spectroscopy
- NIR
- FT-IR
- Raman
- NMR
- Others
By Component
- Hardware
- Software
By Application
- Polymer
- Pharmaceuticals
- Water & Wastewater Management
- Pulp & Paper
- Oil & Gas
- Metal & Mining
- Chemical
- Food & Agriculture
- Others
By Region
- North America
- Europe
- Asia-Pacific
- Latin America
- The Middle East and Africa
For inquiries regarding discounts, bulk purchases, or customization requests, please contact us at sales@precedenceresearch.com
Frequently Asked Questions
Ask For Sample
No cookie-cutter, only authentic analysis – take the 1st step to become a Precedence Research client
 Get a Sample
 Table Of Content
 sales@precedenceresearch.com
 +1 804-441-9344
 Schedule a Meeting