Middle East Nanocomposites Market Size is USD 996.93 Million in 2026
Middle East Nanocomposites Market (By Product: CNT, Nanoclay, Metal/Metal Oxides, Ceramics, Other Products; By Application: Packaging, Automotive, Electronics & Electrical, Aviation, Energy, Construction, Military & Defense, Other Applications) Industry Size, Share, Growth, Trends 2026 to 2035.


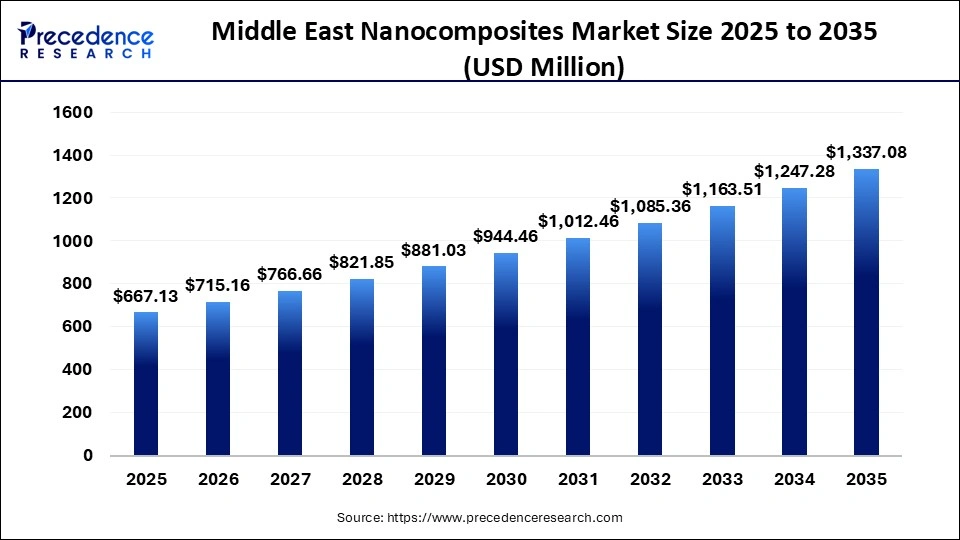
The Middle East nanocomposites market size was estimated at USD 667.13 million in 2025 and is expanding at a CAGR of 7.2% from 2026 to 2035. The market is growing due to the excellent mechanical, thermal, and barrier properties of nanocomposites.
Middle East Nanocomposites Market Statical Scope
| Reports Attributes | Statistics |
| Market Size in 2025 | USD 667.13 Million |
| Market Size in 2026 | USD 715.16 Million |
| Market Size by 2035 | USD 1,337.08 Million |
| CAGR 2026 to 2035 | 7.2% |
| Base Year | 2025 |
| Forecast Period | 2026 to 2035 |
Nanocomposites are gaining significance due to their diverse capabilities, such as strong tensile strength, enhanced optical and magnetic properties, excellent corrosion resistance, and high thermal and electrical conductivity.
The growth of this market is driven by the increasing demand for lightweight and durable materials in the automotive and aerospace industries. Expanding applications in electronics, construction, and packaging are further propelling the market forward. Investments in research and development to create multifunctional nanocomposites are strengthening the competitive landscape.
Additionally, increasing government initiatives in the Middle East to promote advanced materials and nanotechnology are expected to contribute significantly to market expansion.
Middle East Nanocomposites Market Share, By Country, 2025
The Saudi Arabian composites market is driven by a strong focus on diversifying its industries under Vision 2030. Investments in nanotechnology centers and collaborations with global universities are enhancing the applications of nanocomposites in the oil and gas, aerospace, and automotive sectors. The country is leveraging nanocomposites to improve material performance in harsh environments, particularly in pipeline coatings and industrial infrastructure.
Middle East Nanocomposites Market Share, By Product, 2025, (%)
| Segments | Shares (%) |
| Nanoclay | 56% |
| Metal/Metal Oxide | 12% |
| Carbon Nanotubes (CNT) | 14% |
| Ceramics | 18% |
- Nanoclay- It drives product demand due to affordability and versatile reinforcement properties, and holds a 56% share. It is widely used across industries.
- Metal/metal oxide- It is expanding with high-performance applications and, with a 12% share, is growing fastest in industrial adoption.
- CNT- Rising focus on renewable energy systems and the increasing adoption of electric vehicles boost the carbon nanotube segment growth with 14% share.
- Ceramics- This segment holds 18% share due to excellent thermal stability, wear resistance, and mechanical strength.
Middle East Nanocomposites Market Share, By Application, 2025, (%)
| Segments | Shares (%) |
| Electronics & Electricals | 18% |
| Energy | 36% |
| Packaging | 22% |
| Automotive | 24% |
- Electronics & electricals- It drives significant demand for nanocomposites, with high usage in circuits and devices accounting for an 18% share.
- Energy- It expands with batteries and energy storage solutions, with a 36% share, and is growing rapidly.
- Packaging- the packaging segment holds 22% share due to growing demand for improved barrier properties, lightweight materials, and longer product shelf life.
- Automotive- Demand for lightweight materials to enhance fuel efficiency and rise in electric vehicle range are driving the automotive segment with 24% share.
Top Companies in the Middle East Nanocomposites Market
- Arkema S.A.
- BASF SE
- Cabot Corporation
- DuPont de Nemours, Inc.
- Evonik Industries AG
- Nanocyl SA
- Zyvex Technologies
- Mineral Technologies Inc.
- Powdermet Inc.
- RTP Company
Segments Covered in the Report
By Product
- CNT
- Nanoclay
- Metal/Metal Oxides
- Ceramics
- Other Products
By Application
- Packaging
- Automotive
- Electronics & Electrical
- Aviation
- Energy
- Construction
- Military & Defense
- Other Applications
| Product | 2025 | 2026 | 2027 | 2028 | 2029 | 2030 | 2031 | 2032 | 2033 | 2034 | 2035 |
|---|---|---|---|---|---|---|---|---|---|---|---|
| CNT | 122.75 | 134.45 | 147.20 | 161.09 | 177.08 | 194.52 | 212.51 | 232.04 | 253.24 | 273.76 | 295.86 |
| Nanoclay | 317.55 | 336.13 | 356.50 | 378.06 | 400.85 | 424.92 | 451.33 | 479.27 | 508.81 | 541.29 | 573.06 |
| Metal Oxides | 94.73 | 103.70 | 113.47 | 124.10 | 135.67 | 148.25 | 161.91 | 176.74 | 192.84 | 210.30 | 229.22 |
| Ceramics | 75.39 | 80.10 | 85.10 | 90.41 | 96.03 | 101.98 | 108.28 | 114.94 | 121.98 | 129.41 | 137.27 |
| Others | 56.71 | 60.79 | 64.40 | 68.22 | 71.36 | 74.60 | 77.92 | 81.32 | 84.80 | 89.59 | 97.29 |
| Application | 2025 | 2026 | 2027 | 2028 | 2029 | 2030 | 2031 | 2032 | 2033 | 2034 | 2035 |
|---|---|---|---|---|---|---|---|---|---|---|---|
| Packaging | 152.11 | 161.63 | 171.73 | 182.46 | 193.82 | 205.85 | 218.58 | 232.04 | 246.27 | 261.31 | 277.20 |
| Automotive | 101.40 | 107.99 | 115.00 | 122.46 | 130.39 | 138.81 | 147.74 | 157.22 | 167.28 | 177.94 | 189.24 |
| Electronics | 117.41 | 128.73 | 141.07 | 154.51 | 169.15 | 185.07 | 202.39 | 221.20 | 241.63 | 263.80 | 287.86 |
| Aviation | 62.71 | 67.94 | 73.60 | 79.72 | 86.34 | 93.48 | 101.19 | 109.52 | 118.49 | 128.17 | 138.60 |
| Energy | 68.71 | 75.81 | 83.57 | 92.05 | 101.31 | 111.42 | 122.44 | 134.45 | 147.53 | 161.77 | 177.25 |
| Construction | 74.05 | 78.67 | 83.57 | 88.76 | 94.27 | 100.09 | 106.25 | 112.77 | 119.65 | 126.92 | 134.60 |
| Defense | 50.70 | 53.64 | 56.73 | 60.00 | 63.43 | 67.04 | 70.84 | 74.82 | 78.99 | 83.37 | 87.96 |
| Others | 40.03 | 40.76 | 41.40 | 41.92 | 42.29 | 42.49 | 42.50 | 42.29 | 41.82 | 41.06 | 39.98 |
Research Methodology
Related Databooks
March 2026
March 2026
April 2026
April 2026

 sales@precedenceresearch.com
 +1 804-441-9344
 Download Databook
 Schedule a Meeting