Healthcare Payment Integrity Market Size, Share, Trends, Companies, and Forecast 2026-2035
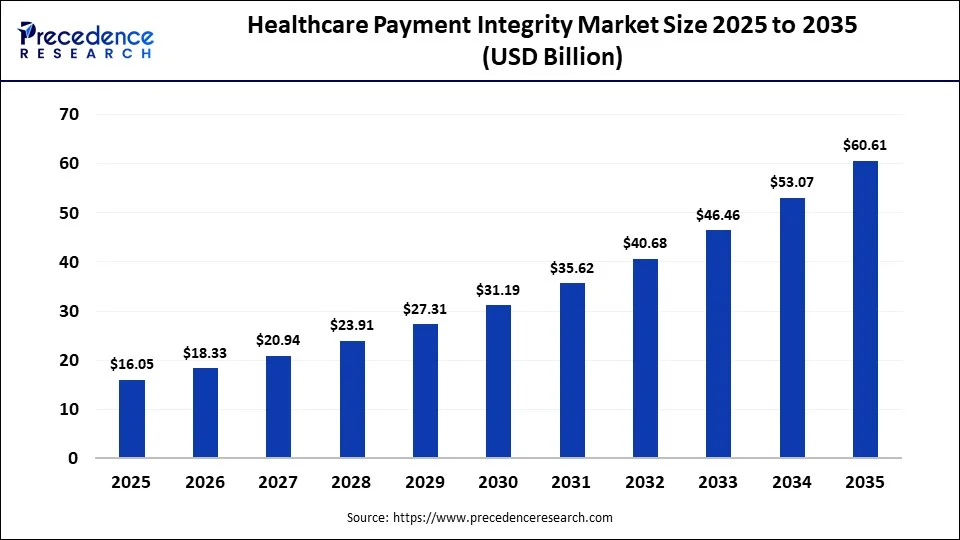
Our analysts examined the healthcare payment integrity market across claims editing, fraud, waste and abuse detection, coding and clinical validation, provider analytics, payment accuracy, technology adoption, competitive positioning, and cost-containment strategies. The analysis is intended to help health insurers, healthcare providers, government payers, and payment-integrity vendors assess market opportunities and changing buyer priorities. The market is projected to reach USD 60.61 billion by 2035.
Source: https://www.precedenceresearch.com/healthcare-payment-integrity-market
 Get a Sample
 Table Of Content


Healthcare Payment Integrity Market Size and Forecast 2026 to 2035
Payment integrity is moving closer to the claims-adjudication process as payers seek to identify payment errors earlier in the cycle. Claims-editing engines, clinical rules, provider-level analytics, and machine learning can flag duplicate claims, coding inconsistencies, unsupported services, unusual provider activity, and potential fraud before or shortly after payment. This does not eliminate retrospective recovery; it expands payment integrity from recovering losses after payment to preventing or reducing avoidable leakage earlier. The market was valued at USD 18.33 billion in 2026 and is projected to grow at a 14.21% CAGR through 2035.
Key Takeaways
- By application, the claim processing segment led the market with a 22.4% share in 2026.
- By end user, the healthcare payers segment captured a major revenue share of 41.2% in 2026.
- By payer type, private health insurance accounted for the largest share of the healthcare payment integrity market at 36.8% in 2026.
Market Overview
Payment Integrity is Moving From Retrospective Recovery Toward Continuous Payment Precision
The market is evolving from predominantly post-payment auditing toward a broader model that includes pre-payment intervention, concurrent review, AI-assisted anomaly identification, clinical validation, and continuous monitoring. This reflects a growing emphasis on identifying payment issues earlier, when intervention can prevent avoidable expenditure rather than relying only on recovery after payment. The market is projected to expand from USD 18.33 billion in 2026 to USD 60.61 billion by 2035.
- Key Insight: The market is projected to reach approximately USD 31.19 billion in 2030, rising from USD 18.33 billion in 2026 to USD 60.61 billion by 2035 at a CAGR of 14.21%.
Source: Precedence Research Database
Market Size - A USD 44.56 Billion Incremental Opportunity Is Emerging Through 2035
The market is estimated at USD 18.33 billion in 2026 and is projected to reach USD 60.61 billion by 2035. The intermediate 2030 estimate is approximately USD 31.19 billion. The forecast points to expanding demand for payment-integrity technology and services as payers adopt earlier intervention, cloud deployment, analytics, and AI-assisted review.
Healthcare payers remain the largest end-user group, accounting for 41.2% of market demand in 2026, while providers accounted for 26.5%. The buyer landscape also extends to government healthcare agencies, third-party administrators, and self-insured organizations. This breadth indicates that payment integrity is being applied across different payment and reimbursement environments rather than remaining limited to traditional commercial health plans.
Key Insight: Market growth will be driven by the use of AI, cloud-based systems, and earlier payment interventions and will increase from USD 18.33 billion in 2026 to USD 60.61 billion by 2035. Providers representing nearly 26.5% of demand are growing, as are payers, who represent the highest share, 41.2%.
Source: Precedence Research Database
Market Dynamics - Rising Medical Spend and Claim Complexity Are Moving Intervention Earlier
| Data | Description |
| 3% | Conservative NHCAA estimate of annual U.S. health spending lost to fraud - tens of billions of dollars |
| Up to 10% | Upper-bound estimate cited by government and law-enforcement agencies - potentially $300B+ annually |
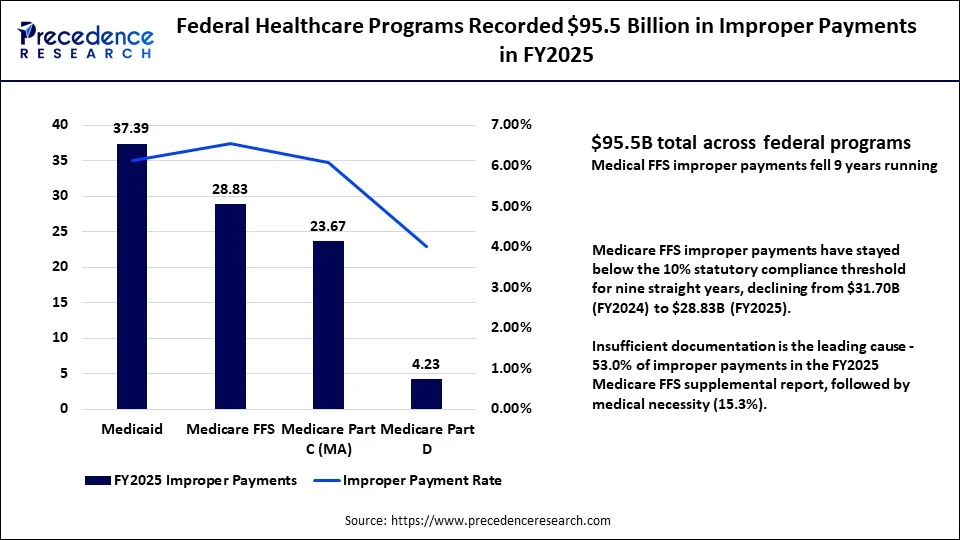
| 53.00% | Share of FY2025 Medicare FFS improper payments attributed to insufficient documentation alone |
One of the main drivers of demand for payment integrity is the financial impact of payment errors. CMS reported approximately USD 95.5 billion in improper payments across major federal healthcare programs in FY2025. Improper payments should not be treated as equivalent to fraud because they can also result from insufficient documentation and other administrative or payment errors. NHCAA's fraud estimate should be presented as an industry estimate rather than as a current measured loss.
Payment integrity is expanding beyond traditional recovery of incorrect payments. Payers are increasingly combining pre-payment editing, provider analytics, coding intelligence, clinical validation, and AI-assisted claim scoring to identify issues earlier. Evolving fraud patterns and connected claims and provider data are also increasing demand for graph analytics, machine learning, and behavioral models.
Implementation remains a significant constraint. Payment-integrity platforms must connect with claims systems, provider databases, eligibility records, clinical documentation, and payment engines while maintaining data quality and workflow alignment. Poorly calibrated models can generate false positives, increasing administrative workload and provider friction. Vendors therefore need to balance detection sensitivity with explainability, review capacity, and operational impact.
- Key Insight: Demand is supported by payment-accuracy requirements, evolving fraud risks, and adoption of earlier AI-assisted controls. Integration complexity and false positives remain important barriers because payment-integrity systems must operate within established claims, provider, clinical, and payment workflows.
Source: National Health Care Anti-Fraud Association (NHCAA); U.S. Centers for Medicare & Medicaid Services (CMS)
Pricing Analysis - Outcome-Based Commercial Models Are Reshaping Vendor Economics
Payment-integrity commercial models are increasingly linked to how value is delivered and measured. Pricing can be structured around claims volume, reviewed claims, subscriptions, transactions, recoveries, avoided costs, or measured savings rather than a standalone software license.
Software-led solutions generally support recurring platform revenue, while services may use per-claim, transaction-based, recovery-share, or managed-service structures. Outcome-based models align vendor compensation more closely with measurable savings or payment-accuracy improvements, increasing the importance of detection quality and transparent measurement.
This is a qualitative analysis of the market pricing as opposed to a list of vendor pricing. The Terms and Conditions in a detailed form are not made public, and individual contract negotiations take place according to the terms of each business.
| Commercial Model | How It Works | Typical Fit |
| Subscription/Platform License | Recurring fee for software access, independent of claims volume | Software-led analytics and monitoring platforms |
| Per-Claim/Transaction Fee | Fee scales with the number of claims reviewed or processed | High-volume claims editing and screening |
| Contingency/Recovery-Share | Vendor is paid a percentage of dollars actually recovered | Post-payment recovery, subrogation, overpayment identification |
| Managed-Service Fee | Bundled fee covering technology plus outsourced clinical or coding review | Full-service audit, clinical validation, and recovery operations |
| Outcome-Based/Savings-Share | Payment tied to measured, verified payment-accuracy improvement | Pre-payment prevention and continuous monitoring programs |
Key Insight: The payment-integrity pricing is moving away from software licensing payments towards claims volume, recoveries, avoided costs, subscriptions, and outcome models. Therefore, measurable savings and accuracy in detection rely on payments, which are of increasing importance.
Source: Precedence Research Database
Demand-Supply Analysis - Demand Is Outpacing Conventional Manual Payment Review Capacity
The scale and complexity of healthcare claims make fully manual review difficult for large payers. Automated screening can prioritize high-volume claim populations, while complex cases can be routed to clinicians, coders, or investigators. This creates a human-in-the-loop operating model in which technology handles screening and prioritization while specialized professionals address higher-complexity cases.
Vendors are increasingly combining analytics, claims editing, clinical expertise, recovery, and managed services rather than offering isolated capabilities. The strategic advantage comes from differentiated data, workflow integration, and sufficient human review to turn detection into an actionable payment decision.
- Key Insight: Human-in-the-loop models remain important as AI expands claims screening at scale. Automated systems can prioritize large volumes of claims, while clinicians, coders, and investigators continue to handle cases requiring deeper contextual or clinical judgment.
Value Chain & Supply Chain - Data, Analytics and Clinical Expertise Capture the Highest Strategic Value
| Payment Integrity Value Chain Stage | Activities/Description |
| Data Intake | Claims, eligibility, provider & clinical data |
| Normalization & Rules | Data cleansing and rules-engine screening |
| Analytics & AI Scoring | Predictive, ML and generative AI risk scoring |
| Clinical / Coding Review | Specialist validation of flagged high-value claims |
| Intervention | Pre-pay edit, concurrent hold, or post-pay flag |
| Recovery & Reporting | Recoupment, subrogation, and payer reporting |
The payment-integrity value chain begins with claims, eligibility, and related healthcare data and extends through data normalization, rules engines, predictive analytics, clinical and coding validation, intervention, recovery, and reporting. Strategic value is concentrated in differentiated data, analytical models, payer-workflow integration, and specialized clinical expertise.
- Key Insight: Analytics, AI-assisted scoring, clinical review, and coding expertise are important sources of differentiation because they combine specialized data, domain knowledge, and workflow integration that are difficult to replicate quickly.
Source: Precedence Research Database
Technology & Innovation - AI Is Expanding from Detection into Real-Time Payment Decisioning
AI and machine learning accounted for 24.6% of technology demand in 2026 and are projected to reach 30.8% by 2035. Generative AI is reported as the fastest-growing technology category at a 26.0% CAGR, while graph analytics is projected to grow at 18.5%. These technologies can support predictive scoring, document intelligence, natural-language processing, relationship analysis, and investigation workflows. The broader shift is from isolated anomaly detection toward payment intelligence that combines claims, provider, clinical, and cost information.
- Key Insight: AI and machine learning are broadening payment integrity from rule-based fraud and error detection toward more contextual payment intelligence. Generative AI has the fastest reported technology CAGR, while human review remains important for complex decisions.
Regulatory, Reimbursement and Healthcare Economics - Improper-Payment Control Is Becoming a Strategic Requirement
Payment integrity intersects with reimbursement accuracy, coding, documentation, risk adjustment, eligibility verification, and financial-program monitoring. Government healthcare programs are particularly important because of their large claims volumes and the financial impact of payment errors. Even incremental improvements in payment accuracy can translate into material savings across large programs.
CMS reported approximately USD 95.5 billion in improper payments across major federal healthcare programs in FY2025. Medicaid accounted for USD 37.39 billion, or 6.12%, while Medicare Fee-for-Service accounted for USD 28.83 billion, or 6.55%. These are improper-payment measures and should not be presented as direct measures of fraud.
- Key Insight: Federal healthcare programs recorded approximately USD 95.5 billion in improper payments in FY2025. The figure should be interpreted as an improper-payment measure rather than a fraud-loss estimate; the 53.0% documentation figure should be retained only if its underlying source table is supplied.
Source: Precedence Research Database
Customer & Application Analysis - Payers Remain the Core Buyer While Providers Become an Important Secondary Market
| Competitive Tier | Companies |
| Market Leaders |
|
| Technology/Government Leaders |
|
| AI Challengers & Specialists |
|
| Scale Players & Diversified IT |
|
Healthcare payers accounted for 41.2% of demand in 2026, followed by providers at 26.5% and government healthcare agencies at 13.8%. Claims processing was the largest application at 22.4%, followed by claims auditing at 18.7% and fraud detection at 17.1%. Contract and pricing validation and payment recovery are smaller but faster-growing application areas, with reported CAGRs of 25.1% and 17.9%.
- Key Insight: Payers remain the core buyer group, while claims processing is the largest application. Contract and pricing validation stands out for growth, suggesting increasing demand for specialized payment-accuracy decisions alongside traditional claims review.
Source: Precedence Research Database
Competitive Landscape - Integrated Payment-Integrity Platforms Are Gaining Advantage Over Point Solutions
The competitive landscape covers 20 companies grouped according to platform breadth, evidence of savings, technology capabilities, and payer or customer reach. Broad platform leaders include Optum, Cotiviti, Zelis, and Claritev. Technology and government-focused players include EXL, Gainwell Technologies, Carelon, and Conduent, reflecting the market's combination of large-scale healthcare operations, government-program expertise, and advanced analytics.
AI-native and specialist vendors such as Machinify, Lyric, FICO, SAS, and MDaudit compete through specialized analytics, automation, fraud detection, or payment-accuracy capabilities. The market remains fragmented across multiple workflows, so competitive positioning increasingly depends on integrating capabilities into payer workflows while maintaining measurable outcomes.
- Key Insight: The competitive field combines integrated platforms with specialist and AI-native challengers. Vendors with broader workflow coverage, payer relationships, differentiated data, and measurable savings are positioned to compete across more stages of the payment-integrity lifecycle.
Source: Precedence Research Database
Tentative Leading Company Universe
| Company | HQ | Market Position | Core Strength | Major Applications/Segments |
| Optum | U.S. | Global scale leader | Integrated payment integrity | Claims review, editing, recovery, analytics |
| Cotiviti | U.S. | Payment-integrity specialist | Payment accuracy | FWA, pre-pay, post-pay, recovery |
| Zelis | U.S. | Payment technology leader | Pricing and payment optimization | Pricing, claims, payment integrity |
| Claritev | U.S. | Large healthcare cost-management platform | Network and payment analytics | Payment integrity, repricing |
| EXL | U.S./India | Analytics and services challenger | AI-led healthcare operations | Auditing, recovery, analytics |
| Conduent | U.S. | Government and payer services player | Claims and payment operations | Payment integrity, government programs |
| Gainwell Technologies | U.S. | Government healthcare specialist | Medicaid/Medicare technology | Claims, program integrity |
| Waystar | U.S. | Healthcare payments platform | Revenue-cycle connectivity | Claims, payment workflows |
| Experian Health | U.S. | Healthcare data/analytics provider | Identity and revenue-cycle data | Eligibility, claims, analytics |
| FinThrive | U.S. | Healthcare financial technology player | Revenue-cycle intelligence | Claims and payment analytics |
| FICO | U.S. | Analytics technology provider | Decisioning and fraud analytics | Fraud, risk, anomaly detection |
| SAS | U.S. | Advanced analytics provider | AI and predictive analytics | Fraud and payment analytics |
| Edifecs | U.S. | Healthcare interoperability specialist | Claims/data interoperability | Claims validation, compliance |
| HealthEdge | U.S. | Payer technology specialist | Core administration and payment | Claims and payment workflows |
| Machinify | U.S. | AI-native challenger | AI payment integrity | Claims, FWA, payment accuracy |
| Lyric | U.S. | Payment integrity specialist | AI and payment analytics | Claims accuracy, FWA |
| CodaMetrix | U.S. | AI clinical-coding specialist | Autonomous coding | Coding validation, documentation |
| TREND Health Partners | U.S. | Payment integrity specialist | Audit and recovery | Claims review, recovery |
| Inovalon | U.S. | Healthcare data/analytics player | Data intelligence | Claims, quality, risk |
| VisiQuate | U.S. | Healthcare analytics specialist | Financial analytics | Claims and revenue intelligence |
| HMA | U.S. | Healthcare services provider | Payment and claims services | Audit and recovery |
| HMS Holdings (related capabilities) | U.S. | Government healthcare specialist | Program integrity | Medicaid, eligibility, recovery |
Source: Precedence Research Database
Market Share and Competitive Ranking - Scale, Claims Data and Workflow Integration Define Leadership
| Competitive Tier | Indicative Market Share Position |
| Leading individual platform | ~10-15% |
| Second-tier global specialist | ~8-13% |
| Major payment technology provider | ~6-10% |
| Large healthcare analytics/service provider | ~4-7% |
| Specialist/challenger vendors | ~1-5% each |
| Remaining market | Majority fragmented share |
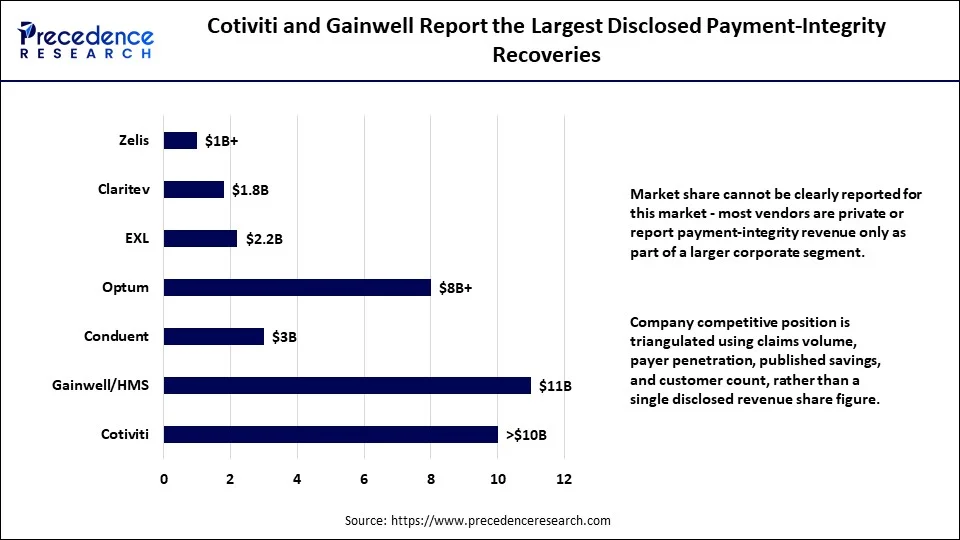
Standalone payment-integrity revenue is not consistently disclosed by diversified healthcare companies, so the indicative market-share bands in this report should be treated as estimates rather than audited company market shares. Published savings and recovery figures provide context on operating scale, but they are not directly comparable because definitions, periods, programs, and methodologies differ. Reported figures in the source material include approximately USD 11 billion for Gainwell, more than USD 10 billion for Cotiviti, more than USD 8 billion for Optum, USD 3 billion for Conduent, USD 2.2 billion for EXL, USD 1.8 billion for Claritev, and more than USD 1 billion for Zelis.
There is no clean market share number available, so published annual savings and recovery data is the best available proxy for competitive scale. Of the four, Gainwell (formerly known as HMS) leads the pack with the largest reported amount of USD 11 billion in annual savings and recoveries, slightly ahead of Cotiviti at over USD 10b. The totals reported by Optum are over USD 8 billion. Those reported by Conduent are USD 3 billion, EXL's is USD 2.2 billion, Claritev's is USD 1.8 billion, and Zelis reports more than USD 1 billion.
- Key Insight: Reported savings and recovery figures suggest substantial scale among several leading vendors, but they should be compared cautiously because companies use different definitions and reporting periods. Standalone payment-integrity market share is also not consistently disclosed.
Source: Precedence Research Database
Competitive Benchmarking - Data Scale and End-to-End Coverage Are the Core Differentiators
Large integrated platforms benefit from established payer relationships and embedded claims workflows. Specialist vendors differentiate through focused capabilities such as fraud analytics, clinical judgment, recovery, or payment intelligence, while AI-native companies compete through faster model deployment and greater automation in screening and investigation workflows.
| Company | Scale | Savings | Customer Reach | AI Capability | Product Breadth | Overall Position |
| Optum | Exceptional | Exceptional | Exceptional | Very Strong | Exceptional | Market Leader |
| Cotiviti | Exceptional | Exceptional | Exceptional | Very Strong | Exceptional | Market Leader |
| Claritev | Very Strong | Very Strong | Very Strong | Very Strong | Very Strong | Market Leader |
| Zelis | Exceptional | Very Strong | Exceptional | Very Strong | Exceptional | Market Leader |
| EXL | Exceptional | Exceptional | Exceptional | Exceptional | Very Strong | Technology Leader |
| Gainwell | Very Strong | Exceptional | Exceptional | Very Strong | Exceptional | Government PI Leader |
| Carelon | Exceptional | Very Strong | Very Strong | Very Strong | Very Strong | Major Challenger |
| Conduent | Very Strong | Very Strong | Very Strong | Strong | Very Strong | Major Challenger |
| Machinify | Strong | Strong | Growing | Exceptional | Very Strong | AI Challenger |
| Lyric | Strong | Strong | Very Strong | Exceptional | Strong | AI Specialist |
Source: Precedence Research Database
Company Payment Integrity Savings & Recovery Performance
| Company | Published Savings/Recovery Metric | Savings Indicator | Payment Integrity Position |
| Optum | USD8B+ annual pre/post-pay savings | Very High | Prevention + recovery |
| Cotiviti | >USD10B errors prevented/corrected in 2025 | Very High | End-to-end payment accuracy |
| Claritev | USD1.8B medical cost savings in 2025 | Very High | Pre-pay + post-pay |
| Zelis | USD1B+ credit-balance recoveries in 2025 | Very High | Pricing + payment integrity |
| EXL | USD2.2B client savings | Very High | AI + analytics + clinical |
| Gainwell/HMS | USD11B total recoveries & savings | Very High | Government + commercial |
| Conduent | USD3B subrogation recovery in one program | High | Recovery + compliance |
| Carelon | Client-specific savings/recoveries | High | Data mining + OPL |
| Machinify | Client-specific measurable savings | High | AI-driven payment integrity |
| Lyric | Client-specific payment-accuracy outcomes | High | Pre-payment |
| FICO | 30-40% more payment irregularities vs. traditional rules in platform testing | High | Predictive analytics |
| SAS | AI/FWA model-driven savings | High | AI + analytics |
Source: Precedence Research Database
Company Customer & Payer Reach
| Company | Customer/Payer Evidence | Reach Rating |
| Cotiviti | 100+ unique payer clients; 23/25 top national payers | Exceptional |
| Zelis | 425+ payers supported | Exceptional |
| Claritev | 300+ payment-integrity clients | Very Strong |
| Gainwell/HMS | 175+ commercial payers; 43M+ lives under contract | Very Strong |
| EXL | 10 of top 12 U.S. health plans | Exceptional |
| Lyric | 190M lives connected | Very Strong |
| Optum | Large national health-plan/TPA ecosystem | Exceptional |
| Carelon | Large employer + commercial + government payer footprint | Very Strong |
| Machinify | Payer + provider-sponsored health plans | Strong / Growing |
| Conduent | Government + commercial health plans | Very Strong |
Source: Precedence Research Database
Product Portfolio Benchmarking - Broad Platforms Versus High-Precision Specialists
The market includes broad payment-integrity platforms as well as specialists focused on individual workflows. Common capabilities include claims editing, pricing and payment review, recovery, coordination, fraud and abuse detection, and coding validation. Specialist providers tend to concentrate on narrower use cases such as AI-based fraud detection, clinical coding, contract validation, provider payment accuracy, or reconciliation.
| Company | Major Capabilities |
| Optum | Data mining, claim review, coding validation, COB, credit balance, overpayment recovery |
| Cotiviti | Payment policy, coding validation, FWA, COB, data mining, clinical chart validation |
| Claritev | Advanced code editing, payment integrity, anomaly detection, medical review, recovery |
| Zelis | Claims pricing, coding validation, payment integrity, contract modeling, complex claim review |
| EXL | FWA, payment leakage, coding/clinical validation, COB, recovery, provider engagement |
| Gainwell | Clinical claim review, payment analytics, FWA, pharmacy integrity, eligibility |
| Carelon | Data mining, OPL, subrogation, payment accuracy |
| Conduent | Subrogation, COB, credit balance, pharmacy audit, ED coding |
| Machinify | Payment integrity, COB, subrogation, clinical/bill review, AI |
| Lyric | Pre-payment accuracy, claims editing, payment integrity, AI decision intelligence. |
- Key Insight: Competitive offerings fall broadly into integrated platforms and specialist solutions. The distinction is increasingly based on workflow breadth versus depth in high-value use cases such as AI-assisted fraud detection, clinical coding, contract validation, and payment accuracy.
Source: Precedence Research Database
Technology and Innovation Benchmarking - AI-Native Platforms Are Challenging Legacy Rules Engines
| Company | AI / Advanced-Analytics Maturity |
| EXL | Very Advanced |
| Optum | Very Advanced |
| Cotiviti | Very Advanced |
| Zelis | Very Advanced |
| Claritev | Very Advanced |
| Machinify | Very Advanced |
| Lyric | Very Advanced |
| Gainwell | Advanced |
| SAS | Very Advanced |
| Carelon | Advanced |
Rules-based analytics accounted for 23.4% of technology demand in 2026 and is projected to decline to 16.5% by 2035, while AI and machine learning rise to 30.8% and generative AI to 9.8%. The technology mix therefore points to a gradual shift from rules-only detection toward models that incorporate context, language, relationships, and healthcare-specific information. Rules remain relevant where payment policies are explicit and explainability is important, but increasingly operate alongside AI-assisted methods.
Key Insight: As both rules-based analytics and AI/ML and generative AI find their feet, eight out of 10 companies rate as Very Advanced for AI maturity with a high competitive floor.
Source: Precedence Research Database
Application Competitive Benchmarking & Geographic Competitive Landscape
Claims processing is the largest application at 22.4% of the market. Contract and pricing validation is the fastest-growing reported application at a 25.1% CAGR, reflecting greater attention to reimbursement-contract intelligence, provider payment validation, risk adjustment, and specialized review. Its smaller starting share means the growth rate should be interpreted as expansion from a niche base rather than current market leadership.
Relaxed pricing regulations and high per capita healthcare expenditure in North America are fueling the region's status as the largest share of global revenue with 40.6%.
North America remains the largest regional market at 40.6% of global revenue in 2026. Asia Pacific accounted for 21.1% and is reported to have the highest regional CAGR at 16.1%. The region represents an important growth opportunity as healthcare systems modernize and payers increase their use of digital infrastructure, analytics, and AI. Europe's 27.8% share remains significant, although its projected share declines over the forecast period.
Key Insight: Claim processing leads the applications with 22.4%, contract and pricing validation is the fastest growth opportunity, and North America accounts for the largest revenues, and Asia-Pacific is the most promising region for growth.
Manufacturing & Capacity Benchmarking/Customer & Channel Benchmarking
Payment-integrity capacity is not constrained by physical manufacturing in the way that asset-intensive industries are. Instead, competitive capacity depends on claims-processing infrastructure, cloud architecture, data processing, clinical-review resources, analytics, and implementation expertise. Because systems must integrate into established claims, payment, provider, and recovery workflows, vendors face meaningful operational barriers to entry. Demonstrable savings and low provider disruption are therefore important to renewals and expansion.
Payment-integrity systems enter the claims-adjudication, payment, provider and recovery processes established by payers, creating significant barriers to entry. Those vendors who can prove on solid data that they offer meaningful cost reduction without adding unnecessarily to the burden on the provider stand a better chance of achieving renewals and expansion decisions.
- Key Insight: Competitive capacity depends less on physical infrastructure and more on scalable data and claims-processing capabilities, clinical expertise, workflow integration, and evidence of measurable financial impact.
Strategic Developments and M&A Landscape - Consolidation Is Building End-to-End Healthcare Payment Platforms
| Date | Event & Details |
| Sep-24 | The Rawlings Group, Apixio Payment Integrity and VARIS merge - New Mountain Capital combines three payment-accuracy and coverage-analytics businesses into a single next-generation platform. |
| Feb-25 | New Mountain Capital agrees to acquire Machinify - The AI-native payments platform is combined with the merged Rawlings/Apixio PIV/VARIS entity, taking the Machinify name; combined revenue exceeds $500 million. |
| 2025 | Machinify acquires Performant Healthcare (Nasdaq: PFMT) for ~$670 million - Adds Performant's audit and recovery expertise and expands reach into government and commercial payer markets; Performant delists from Nasdaq. |
| 2025 | Machinify achieves a 90.5 KLAS First Look performance score - 100% of surveyed customers said they would buy again, with feedback highlighting the platform's NLP and large-language-model capabilities. |
Recent deal activity has centered on AI-enabled claims review, generative-AI workflow automation, real-time payment accuracy, clinical-document intelligence, provider intervention, and platform consolidation. M&A can accelerate the combination of data, payment analytics, clinical expertise, claims technology, and recovery capabilities that would take longer to build organically.
The Machinify transaction provides an example of platform consolidation in the market. In February 2025, New Mountain Capital announced an agreement to acquire Machinify and combine it with the healthcare intelligence and payment platform assembled through the Rawlings, Apixio, and VARIS combination. The transaction illustrates how consolidation can combine AI, healthcare data, payment-integrity, and operational capabilities.
- Key Insight: The Machinify consolidation illustrates a broader strategy of combining AI, healthcare intelligence, payment-integrity capabilities, and operational scale through M&A rather than building every capability organically.
Source: Precedence Research Database
Company Profiles & Strategic Positioning
The company profiles assess business scale, payment-integrity capabilities, financial information, product portfolios, payer relationships, technology, delivery models, coverage, and competitive positioning. Where companies operate across multiple healthcare businesses, total corporate revenue is distinguished from payment-integrity activity to avoid treating diversified companies as pure-play payment-integrity vendors.
Strategic Archetypes
- Market Leaders: broad portfolios, deep payer relationships and integrated claims capabilities - Optum, Cotiviti, Zelis, Claritev
- Scale Leaders: large data and operational infrastructure - Gainwell, Carelon, Conduent
- Technology Leaders: advanced AI, predictive analytics and automation - EXL, Machinify, Lyric, FICO, SAS
- Application Specialists: focused expertise in clinical coding, fraud, recovery or payment accuracy - MDaudit, CodaMetrix, TREND Health Partners
- Growth Challengers: AI-native platforms targeting faster deployment and specialized workflows - Machinify, Lyric
| Company | Scale | Savings/Recoveries Evidence | Payer/Customer Reach | Competitive Strength |
| Optum | 1M+ claims reviewed daily | USD8B+ annual pre- & post-pay savings | National health-plan and TPA footprint | Very Strong |
| Cotiviti | 100+ unique payer clients; 23 of 25 top national payers | >USD10B errors prevented/corrected in 2025 | 100+ payer clients | Very Strong |
| Claritev | Large-scale claims/cost-management platform | USD1.8B payment-integrity medical cost savings in 2025 | 300+ payment-integrity clients | Very Strong |
| Zelis | 250M+ claims processed; USD155B+ claims volume | USD1B+ credit-balance recoveries in 2025 | 425+ payers supported | Very Strong |
| EXL | 3.8B+ claims processed annually | USD2.2B client savings | 10 of top 12 U.S. health plans | Very Strong |
| Gainwell Technologies / HMS | Large Medicaid, Medicare and commercial claims footprint | USD11B total recoveries & savings | 175+ commercial payers; 43M+ lives under contract | Very Strong |
| Carelon | Hundreds of millions of claim payment transactions | Strong recovery and cost-containment programs | Large employer, commercial, Medicare & Medicaid footprint | Very Strong |
| Conduent | Large government and commercial payer operations | USD3B subrogation recoveries in one leading health-plan program | Government + commercial payer presence | Strong |
| Machinify | Multi-solution platform following combination of 4 healthcare technology businesses. | Customer-reported measurable savings | Payer and provider-sponsored health-plan customers | Strong / High-growth |
| Lyric | Platform connected to 190M lives | Strong pre-payment accuracy focus | Leading U.S. health plans | Strong / High-growth |
| FICO | Platform processing hundreds of millions of claim lines/day | Historical implementations show measurable FWA detection | Global analytics/software customer base | Strong |
| SAS | Enterprise-scale healthcare analytics | Payment-integrity AI models commercialized | Government + payer organizations | Strong |
| Cognizant | Large global healthcare-services and claims-processing footprint | Client-specific savings/efficiency programs | Global payer and healthcare-provider base | Strong |
| Inovalon | Large claims and healthcare-data ecosystem | Claims-validation and revenue-cycle optimization | Payers + providers + specialty pharmacies | Strong |
| UST | Claims automation involving millions of records/month | 92% reduction in claims-audit manual effort (case study) | Global healthcare-services footprint | Strong |
| MDaudit | Benchmark database covers ~800,000 providers and 4,000+ facilities | Provider-side revenue recovery and denial analytics | 40+ U.S. states represented in benchmark data | Strong niche |
| Guidehouse | Large healthcare consulting/technology footprint | Program-specific payment-integrity savings | Government and payer concentration | Strong niche |
| Sagility | Large healthcare operations and RCM platform | Client-specific payment and claims savings | Global payer/provider operations | Strong |
| HCLTech | Large healthcare IT and claims-transformation footprint | Client-specific claims automation savings | Global payer/provider customers | Strong |
| Wipro | Global healthcare technology/services footprint | Client-specific claims automation and analytics outcomes | Global payer/provider presence | Strong |
Key Insight: The market covers a wide group of the market leaders and scale players on the one hand and AI technology leaders, application specialists, and new players on the up-and-up who are native to AI technologies on the other.
Source: Precedence Research Database
Opportunity and White-Space Analysis - Continuous Monitoring, Clinical Validation and Contract Intelligence Are High-Value Gaps
Several of the market's highest growth rates come from relatively small bases. Generative AI is reported at a 26.0% CAGR with a 4.8% share, contract and pricing validation at 25.1% CAGR from a 0.7% application share, and subrogation and recovery at 20.8% CAGR from a 1.1% share. Asia Pacific and the Middle East and Africa are also reported as high-growth regions at 16.1% and 16.0% CAGRs. These figures identify areas of expansion, but their smaller starting shares should be considered when assessing near-term market impact.
- Key Insight: Contract and pricing validation has the fastest reported application CAGR at 25.1%, followed by other high-growth areas including generative AI, subrogation and recovery, and continuous payment monitoring. Several of these opportunities are expanding from relatively small bases.
Source: Precedence Research Database
Industry Structure - High Buyer Power and Rising Technology Competition
| Porter's Five Forces & Assessment | Description |
| Supplier Power - MEDIUM | Specialized clinical, claims, and healthcare-data expertise creates barriers, but multiple technology providers reduce dependence on any single supplier. |
| Buyer Power - HIGH | Large payers manage significant claims volumes and demand measurable savings, transparent ROI, and flexible commercial structures. |
| Threat of New Entrants - MEDIUM | Cloud infrastructure lowers technology barriers, but healthcare data access, payer integration, and historical claims datasets remain significant barriers. |
| Threat of Substitutes - LOW-MEDIUM | Internal payer teams can perform some payment-integrity activities, but advanced analytics and automation increasingly favor specialized platforms. |
| Competitive Rivalry - HIGH | Broad healthcare technology companies, payment-integrity specialists, and AI-native entrants increasingly compete for the same payer budgets. |
A Porter's Five Forces assessment indicates strong buyer influence and meaningful competitive rivalry. Large payers control substantial claims volumes and can evaluate vendors on measurable savings, payment-accuracy outcomes, implementation risk, and commercial flexibility. This gives sophisticated buyers leverage when selecting or renewing payment-integrity providers.
The threat of new entrants is moderate. Cloud infrastructure lowers the technical barrier to launching analytics products, but access to healthcare data, payer workflows, historical claims information, clinical expertise, and trusted customer relationships remains difficult to build quickly. These factors favor vendors that can demonstrate domain knowledge and operational performance.
- Key Insight: Buyer power and competitive rivalry are important forces in the market. Large payers have negotiating leverage, while healthcare data access, workflow integration, and established customer relationships create barriers that limit the ease of entry.
Source: Precedence Research Database
Segmentation Analysis
AI, Clinical Validation, Recovery and Continuous Monitoring Are Taking Share
Fraud, waste, and abuse detection remains the largest segment, with a 35.6% market share in 2026, while its 12.9% CAGR indicates a more mature growth profile than several smaller categories. Claims editing and coding validation accounted for 19.2% of the market and is projected to grow at 13.5% CAGR. Subrogation and recovery has the smallest reported share at 1.1% but the fastest reported CAGR at 20.8%, indicating a high-growth opportunity from a relatively small base. The segment mix therefore combines established controls with faster-growing specialized functions.
- Key Insight: Fraud, waste, and abuse detection is the largest segment at 35.6%, while subrogation and recovery is the fastest-growing reported category at a 20.8% CAGR from a 1.1% share base.
Pre-payment review accounted for 40.9% of the market in 2026, making it the largest reported service stage. Continuous payment monitoring is the fastest-growing service-stage category, with an 18.9% CAGR despite a smaller 9.4% share base. Its growth reflects a shift toward monitoring payment activity continuously rather than relying only on scheduled or retrospective reviews. Software held 53.8% of the component market, while services recorded a 14.9% CAGR, indicating continued demand for implementation, clinical, coding, and operational expertise alongside technology.
Clinical review and coding validation continue to require specialized expertise even as software automates a growing share of screening and prioritization. Cloud deployment is projected to rise from 59.8% of the market in 2026 to 68.2% by 2035. Cloud architecture can support more frequent updates to models, rules, and data as payment policies, coding patterns, and fraud indicators change.
- Key Insight: Continuous payment monitoring has the fastest reported service-stage CAGR at 18.9%, while cloud deployment is projected to increase from 59.8% in 2026 to 68.2% by 2035. Together, these trends point toward more continuous and centrally managed payment-integrity workflows.
Source: Precedence Research Database
Claim Type and Technology Segmentation
Medical claims accounted for 51.8% of the claim-type market in 2026, making them the largest category in the reported breakdown. Behavioral health claims are the fastest-growing category at a 16.0% CAGR. Rising utilization of behavioral health services and mental-health parity requirements provide relevant market context for this growth, although the CAGR should not be attributed solely to those factors without additional evidence.
- Key Insight: Medical claims remain the largest claim-type category at 51.8%, while behavioral health claims are growing fastest at a reported 16.0% CAGR.
AI and machine learning accounted for 24.6% of the market in 2026 and are projected to reach 30.8% by 2035. These technologies are increasingly used for anomaly detection, claims scoring, pattern recognition, and case prioritization. Generative AI is reported as the fastest-growing technology category, increasing its market share from 4.8% to 9.8% at a 26.0% CAGR. That represents approximately a doubling of share, not two orders of magnitude.
- Key Insight: Generative AI is the fastest-growing reported technology category, with a 26.0% CAGR, while its market share is projected to increase from 4.8% to 9.8% by 2035.
Source: Precedence Research Database
Application, End User, Payer Type, Organization Size and Region
Claims processing is the largest application category, accounting for 22.4% of the market in 2026. Contract and pricing validation has the fastest reported application growth at a 25.1% CAGR from a 0.7% share base. This indicates that established claims workflows remain the largest source of demand, while specialized payment decisions are expanding faster from smaller starting points.
Healthcare payers are the largest end-user group, accounting for 41.2% of market demand in 2026, followed by healthcare providers at 26.5%. By payer type, private health insurance accounted for 36.8%, government health insurance 20.1%, and employer-sponsored insurance 15.8%. Government health insurance is reported to grow at a 15.7% CAGR, compared with 13.3% for employer-sponsored insurance.
North America held the largest regional share at 40.6% in 2026 and is projected to account for around 38.5% by 2035. Europe's share is projected to decline from 27.8% to approximately 25.8%, while Asia Pacific is projected to increase from 21.1% to around 24.5%. The regional outlook therefore combines continued North American leadership with faster share gains in Asia Pacific. Large organizations accounted for 81% of the market in 2026, compared with 19% for small and mid-sized organizations.
Naturally, by organization size, those organizations that are Large (81%) will have a far greater share of the market in 2026, as only a large health plan or hospital system. That would have the transaction volume to warrant a full payment-integrity platform, and small and mid-sized organizations will account for the remainder (19%).
- Key Insight: Contract and pricing validation is the fastest-growing reported application at a 25.1% CAGR from a 0.7% share base. Government healthcare agencies are projected to record the highest end-user growth rate at 16.0%, while Asia Pacific is a leading regional growth opportunity.
Source: Precedence Research Database
PESTLE Analysis - Healthcare Economics and Regulation Will Continue to Shape Adoption
| PESTLE Factor | Description |
| Political | Government scrutiny of improper payments and healthcare affordability |
| Economic | Rising medical expenditure increases the financial value of payment accuracy |
| Social | Patients and providers increasingly expect transparent, accurate, and timely payments |
| Technological | AI, NLP, graph analytics and cloud infrastructure are transforming claims review |
| Legal | Coding, documentation, reimbursement, privacy and fraud regulations raise compliance needs |
| Environmental | Limited direct impact, though sustainability affects data-center efficiency and procurement |
Political and regulatory pressure is linked to scrutiny of improper payments, program integrity, and healthcare affordability. Economic pressure comes from rising healthcare expenditure and the need to manage payment leakage. Technological change is increasingly relevant because AI, cloud infrastructure, analytics, and automation are changing how claims and payment data are reviewed. Environmental factors have a more limited direct effect on payment-integrity adoption.
Key Insight: The PESTLE picture is dominated by political and economic pressures, government investigation of faulty settlements, and increasing expenditures on treating claims, though technological change is evolving the basis on which claims are being reviewed on a day-to-day basis.
Source: Precedence Research Database
Market Attractiveness - High Growth, Strong Recurring Demand and Significant Switching Barriers
Market attractiveness is supported by the projected 14.21% CAGR, recurring payer demand, ongoing payment-accuracy requirements, healthcare spending, and increasing adoption of AI and analytics. Switching costs can become meaningful once payment-integrity systems are integrated into claims and payment workflows. The combination of recurring demand and workflow integration can support durable vendor relationships, although buyers continue to evaluate providers on measurable outcomes and implementation performance.
Key Insight: High growth, recurring payer demand, switching costs, rising healthcare spending, and AI adoption make the market highly attractive in the coming years.
Future Outlook - Payment Integrity Will Evolve Into Continuous Healthcare Payment Intelligence
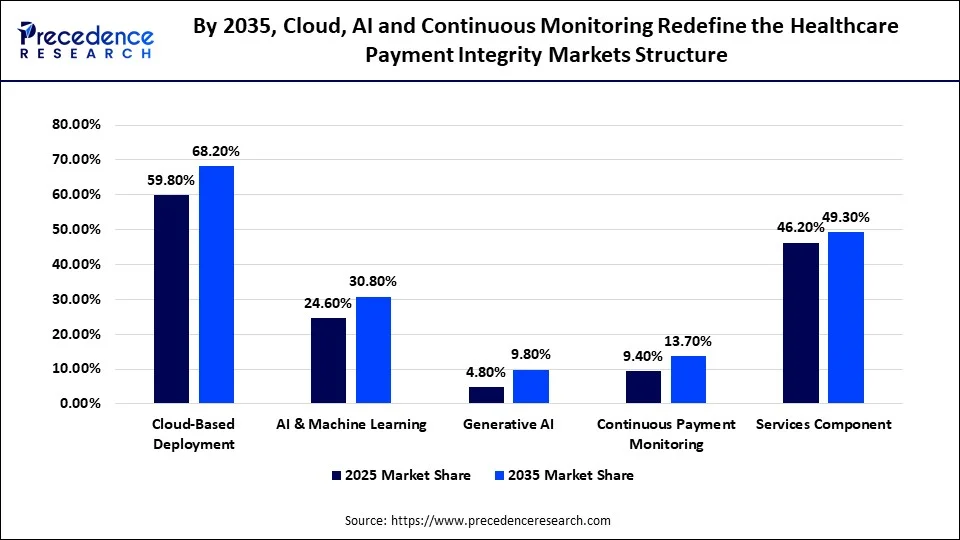
The projected USD 60.61 billion market in 2035 is expected to have a different technology and service mix. Cloud deployment is projected to rise from 59.8% to 68.2%, AI and machine learning from 24.6% to 30.8%, generative AI from 4.8% to 9.8%, and continuous payment monitoring from 9.4% to 13.7%. Taken together, these shifts point toward payment-integrity infrastructure that is more cloud-based, more AI-assisted, and more continuously monitored.
Key Insight: By 2035, cloud deployment rises from 59.8% to 68.2%, while AI/ML increases from 24.6% to 30.8% and Generative AI more than doubles from 4.8% to 9.8%. Continuous Payment Monitoring jumps from 9.4% to 13.7%, with many moving to cloud-based, AI-centric, and continually monitored payment-integrity infrastructure.
Source: Precedence Research Database
Expert Insights
Our analysts expect the strongest opportunities to emerge where rules-based claims editing, provider analytics, clinical validation, fraud and abuse detection, and AI-assisted review work together. As reimbursement rules and claim complexity evolve, payers will continue to need mechanisms that identify coding inaccuracies, duplicate claims, unsupported services, and unusual provider patterns earlier in the payment cycle. AI-assisted review is likely to become an increasingly important competitive capability, particularly where it improves screening scale without replacing clinical and investigative judgment.
Our Experts
Payal Rabde led the primary market research, analyzed trends, developed the methodology, competition, segmentation, forecasts, and strategic opportunities, forming the report's analytical foundation.
The market estimates were enhanced by data collected and validated from regulatory filings, company financial information, healthcare expenditure data, and other quantitative information from independent sources gathered by Aman.
Aditi reviewed the whole research, did quality checks, gauged data authenticity, corrected inconsistencies, and improved the content to make it accurate, consistent, and clear.
Healthcare Payment Integrity Market Segmentation
By Solution Type
- Fraud, Waste & Abuse (FWA) Detection
- Claims Editing & Coding Validation
- Payment Accuracy & Underpayment Recovery
- Coordination of Benefits (COB)
- Duplicate & Overpayment Detection
- Eligibility & Coverage Validation
- Provider Payment Validation
- Medical Necessity & Clinical Validation
- Contract Compliance & Repricing
- Subrogation & Recovery
By Service Stage
- Pre-Payment Review
- Concurrent Payment Review
- Post-Payment Review
- Continuous Payment Monitoring
By Component
- Software
- Services
By Deployment Mode
- Cloud-Based
- On-Premises
- Hybrid
By Claim Type
- Medical Claims
- Pharmacy Claims
- Dental Claims
- Vision Claims
- Durable Medical Equipment (DME) Claims
- Behavioral Health Claims
- Home Health Claims
- Specialty Claims
By Technology
- Artificial Intelligence & Machine Learning
- Predictive Analytics
- Rules-Based Analytics
- Natural Language Processing
- Generative AI
- Robotic Process Automation
- Data Analytics
- Graph Analytics
- Computer Vision
By Application
- Claims Processing
- Claims Auditing
- Payment Reconciliation
- Fraud Detection
- Provider Validation
- Medical Coding Validation
- Payment Recovery
- Eligibility Verification
- Risk Adjustment
- Contract & Pricing Validation
By End User
- Healthcare Payers
- Healthcare Providers
- Government Healthcare Agencies
- Third-Party Administrators
- Employers & Self-Insured Organizations
- Pharmacy Benefit Managers
- Healthcare Networks
By Payer Type
- Private Health Insurance
- Government Health Insurance
- Employer-Sponsored Insurance
- Medicare
- Medicaid
- Managed Care Organizations
By Organization Size
- Small & Medium Organizations
- Large Enterprises
By Region
- North America (U.S., Canada, Mexico)
- Europe (Germany, U.K., France, Italy, Spain, Netherlands, Switzerland, Rest of Europe)
- Asia-Pacific (China, Japan, India, South Korea, Australia, Singapore, Rest of Asia-Pacific)
- Latin America (Brazil, Argentina, Mexico, Rest of Latin America)
- Middle East & Africa (UAE, Saudi Arabia, Israel, South Africa, Rest of Middle East & Africa)
Questions This Report Deliberately Leaves Open
- What will the size of the Healthcare Payment Integrity Market be in 2030 and 2035?
- What will be the incremental opportunity driver in the overall market opportunity of USD 44.56 billion estimated?
- What are the payment-integrity solution categories that will grow and shrink, respectively, over the coming years by 2035?
- Why do you think Contract & Pricing Validation will outpace traditional payment integrity functions?
- How fast will AI/Generative AI and graph analytics replace traditional rules-based payment-integrity models?
- What are the biggest potential parts of this incremental demand from the perspective of payer and end-user categorizations?
- What will the impact of moving from post payment recovery to pre-payment prevention be on the economics of the vendors?
- Which payment-integrity business models are beginning to materialize throughout payment-integrity services?
- How did the companies fare in terms of size, technology, relations with payers, and extent of their solutions?
- What are the estimated competitive positions and market-share bands of the Top 5 and Top 10 companies?
- Who are the vendors with the sharpest skills in AI, clinical validation, and ongoing monitoring?
- Where are the largest geographic opportunities outside North America?
- What are some M&A & partnership strategies that are likely to move players in the competitive equation?
- What are the good opportunities for solution, technology, and application gaps?
- Which companies are best positioned to capture the next generation of payment-integrity profit pools?
References
- Precedence Research Database
"Healthcare Payment Integrity Market - Market Size, Segmentation, Regional and Company Data"
https://www.precedenceresearch.com
Data used: Market size, CAGR, all segment/regional share tables, and the 20 company competitive benchmark dataset - U.S. Centers for Medicare & Medicaid Services (CMS)
"Fiscal Year 2025 Improper Payments Fact Sheet" - January 15, 2026
https://www.cms.gov/newsroom/fact-sheets/fiscal-year-2025-improper-payments-fact-sheet
Data used: Medicare FFS, Medicare Advantage, Medicaid, and Part D improper payment figures - Becker's Payer Issues
"Medicare Fee-for-Service Improper Payments Hit USD28.8B: CMS" - January 2026
https://www.beckerspayer.com/payer/medicare-fee-for-service-improper-payments-hit-28-8b-cms/
Data used: Medicare FFS improper payment trend and program-level breakdown - National Health Care Anti-Fraud Association (NHCAA)
"The Challenge of Health Care Fraud" - Accessed 2026
https://www.nhcaa.org/tools-insights/about-health-care-fraud/the-challenge-of-health-care-fraud/
Data used: Healthcare fraud loss estimate (3%-10% of national health expenditure) - New Mountain Capital
"New Mountain Capital to Acquire Machinify and Combine with Leading Healthcare Intelligence and Payment Platform" - February 2025
https://www.newmountaincapital.com/new-mountain-capital-to-acquire-machinify-and-combine-with-leading-healthcare-intelligence-and-payment-platform/
Data used: Machinify consolidation M&A timeline - Fierce Healthcare
"New Mountain Capital to Acquire AI Company Machinify to Form USD5B Medical Payments Powerhouse" - January 2025
https://www.fiercehealthcare.com/health-tech/new-mountain-capital-acquire-ai-company-machinify-form-5b-medical-payments-powerhouse
Data used: Machinify combined-entity revenue and strategic rationale - PrivSource
"New Mountain Capital to Acquire Machinify and Combine with Payment Integrity Platform" - 2025
https://www.privsource.com/acquisitions/deal/new-mountain-capital-to-acquire-machinify-and-combine-with-payment-integrity-platform-jDSNdE
Data used: Performant Healthcare acquisition value and rationale
For inquiries regarding discounts, bulk purchases, or customization requests, please contact us at sales@precedenceresearch.com
Frequently Asked Questions





Ask For Sample
No cookie-cutter, only authentic analysis – take the 1st step to become a Precedence Research client
 Get a Sample
.webp)



 sales@precedenceresearch.com
 Schedule a Meeting