U.S. Cloud Kitchen Market Size, Share and Trends 2026 to 2035
U.S. Cloud Kitchen Market (By Type: Independent Cloud Kitchen, Commissary/Shared Kitchen, Restaurant-Branded Cloud Kitchens, Kitchen Pods, and Aggregator-Owned Cloud Kitchens; By Nature of Operation: Single Brand, Multi-Brand, and Hybrid Models; By Cuisine Type: Fast Food (Burgers, Pizzas, etc.), Ethnic Cuisine (Indian, Chinese, Mexican, etc.), Health-Conscious & Organic Food, Gourmet & Premium Offerings, and Others; By Order Source: Online Food Aggregators, Restaurant-Owned Platforms/Websites, Phone Orders, and Walk-in/Takeaway (limited cases); By Technology Platform: Kitchen Management Systems, Order & Delivery Management Software, POS & Payment Gateways, Inventory & Supply Chain Software, Customer Engagement & Loyalty Tools, and AI, Robotics & Automation; By End User: Startups & Small Enterprises, Established Restaurant Chains, Delivery Aggregators, and Catering Services) Industry Size, Share, Growth, Trends 2025-2035
Source: https://www.precedenceresearch.com/us-cloud-kitchen-market
 Get a Sample
 Table Of Content


The U.S. cloud kitchen market size surpassed USD 81.94 billion in 2025 and is predicted to reach around USD 248.2 billion by 2035, registering a CAGR of 11.72% from 2026 to 2035. The market is growing fast due to the rise in online food delivery, widespread smartphone and app use, and the need to cut costs for commercial rent.
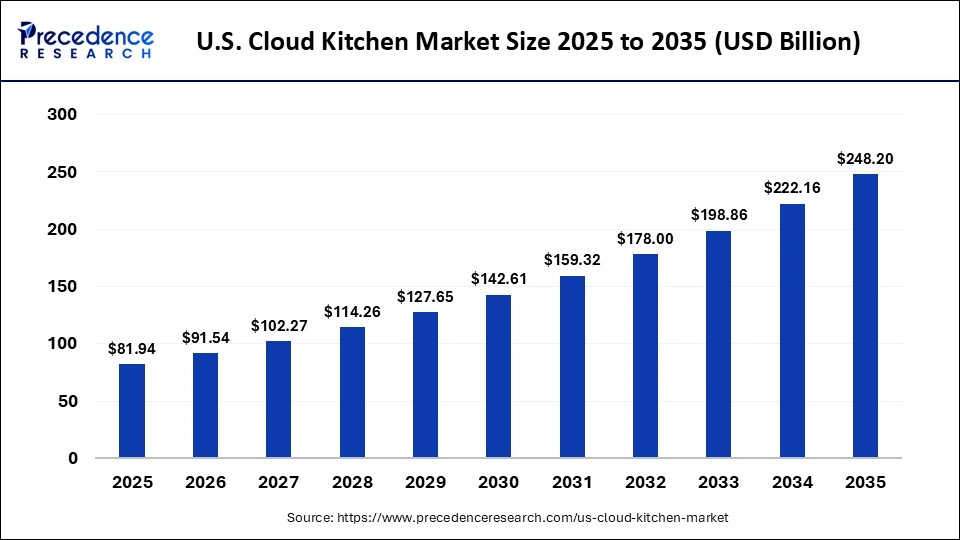
U.S. Cloud Kitchen Market Statical Scope
| Reports Attributes | Statistics |
| Market Size in 2025 | USD 81.94 Billion |
| Market Size in 2026 | USD 91.54 Billion |
| Market Size by 2035 | USD 248.2 Billion |
| CAGR 2026 to 2035 | 11.72% |
| Base Year | 2025 |
| Forecast Period | 2026 to 2035 |
The market is significantly growing as it reduces startup and operational costs by removing the need for storefronts and dine-in facilities. With the increase in online food delivery, businesses can quickly expand virtual brands, experiment with new cuisines based on app data, and satisfy consumer demand for quick and convenient home delivery. Cloud kitchens do not require high-traffic retail locations or visible street addresses. They operate without front-of-house staff, hosts, or waiters.
The initial investment is usually less than half of what a traditional restaurant needs. One kitchen can manage multiple food concepts or menus at the same time. Operators can use real-time data from delivery apps to swiftly modify dishes, prices, and offerings. Brands explore new markets or cities without needing physical dining spaces. The heavy reliance on mobile ordering and third-party services makes delivery-only models very efficient, meeting the modern demand for fast, contactless, and varied meal options delivered right to the door.
U.S. Cloud Kitchen Market, By Type, 2025 (%)
| Segments | Shares (%) |
| Independent Cloud Kitchen | 28.00% |
| Commissary/Shared Kitchen | 20.00% |
| Restaurant-Branded Cloud Kitchens | 22.00% |
| Kitchen Pods | 12.00% |
| Aggregator-Owned Cloud Kitchens | 18.00% |
- Independent Cloud Kitchen - The independent cloud kitchen sector, with a share of 28% in 2025, leads the U.S. cloud kitchen market. It succeeds by providing low startup costs, operational flexibility, and the ability to create delivery-only food brands without the burden of traditional real estate expenses.
- Commissary/Shared Kitchen - The commissary and shared kitchen sector, with a share of 20% in 2025, is the essential economic and infrastructural foundation of the U.S. cloud kitchen market. It provides various food entrepreneurs, caterers, and virtual brand ideas with the opportunity to rent professional-grade commercial space and equipment in one location, reducing high initial capital costs and lowering risk.
- Restaurant-Branded Cloud Kitchens - The restaurant-branded cloud kitchen sector, with a share of 22% in 2025, in which established restaurant chains introduce delivery-only versions of their main brands, is crucial in the U.S. market. It allows legacy chains to extend their reach into new delivery areas without costly real estate investments, using their existing brand reputation to attract off-premise dining customers.
U.S. Cloud Kitchen Market, By Nature of Operation, 2025 (%)
| Segments | Shares (%) |
| Single Brand | 38.00% |
| Multi-Brand | 42.00% |
| Hybrid Models | 20.00% |
- Single Brand - The single-brand sector, with a share of 38% in 2025, is important in the U.S. cloud kitchen market as it ensures strict quality control, a clear brand identity, and simpler operations. This focus fosters strong customer trust and loyalty on delivery platforms compared to managing multiple confusing virtual brands from a single kitchen.
- Multi-Brand - The multi-brand sector, with a share of 42% in 2025, is the leader in the U.S. cloud kitchen market as it optimizes revenue per square foot. By operating several virtual restaurant concepts like burgers, wings, and bowls from one shared kitchen, operators significantly reduce real estate, labor, and utility costs while appealing to a wide range of consumers on delivery apps.
U.S. Cloud Kitchen Market, By Cuisine Type, 2025 (%)
| Segments | Shares (%) |
| Fast Food (Burgers, Pizzas, etc.) | 36.00% |
| Ethnic Cuisine (Indian, Chinese, Mexican, etc.) | 25.00% |
| Health-Conscious & Organic Food | 14.00% |
| Gourmet & Premium Offerings | 13.00% |
| Others | 12.00% |
- Fast Food (Burgers, Pizzas, etc.) - The fast-food sector (burgers, pizzas, and sandwiches), with a share of 36% in 2025, leads the U.S. cloud kitchen market due to these high-margin, standardized foods that travel well, maintain their structure during delivery, and meet consumer demand for quick, affordable, and convenient home delivery.
- Ethnic Cuisine (Indian, Chinese, Mexican, etc.) - The ethnic cuisine segment, with a share of 25% in 2025, which includes Indian, Chinese, Mexican, and other global flavors, is a key player in the U.S. cloud kitchen market. This segment is essential due to changing consumer demographics, a strong preference for digital platforms, and cost-effective preparation methods.
U.S. Cloud Kitchen Market, By Order Source, 2025 (%)
| Segments | Shares (%) |
| Online Food Aggregators | 52.00% |
| Restaurant-Owned Platforms/Websites | 23.00% |
| Phone Orders | 12.00% |
| Walk-in/Takeaway (limited cases) | 13.00% |
- Online Food Aggregators - The online food aggregators segment, with a share of 52% in 2025, accounts for the largest revenue share in the U.S. cloud kitchen market due to the main customer-facing interface and logistical support. Since cloud kitchens do not have physical dining spaces or signage, they depend on major platforms like DoorDash, Uber Eats, and Grubhub to attract customers, manage digital orders, and handle last-mile delivery.
- Restaurant-Owned Platforms/Websites - The restaurant-owned platforms and websites segment, with a share of 23% in 2025, is crucial in the U.S. cloud kitchen market as it provides virtual brands to avoid high fees from third-party aggregators, keep direct customer data, maintain profit margins, and cultivate brand loyalty in a highly competitive digital environment.
U.S. Cloud Kitchen Market, By Technology Platform, 2025 (%)
| Segments | Shares (%) |
| Kitchen Management Systems | 20.00% |
| Order & Delivery Management Software | 24.00% |
| POS & Payment Gateways | 19.00% |
| Inventory & Supply Chain Software | 15.00% |
| Customer Engagement & Loyalty Tools | 10.00% |
| AI, Robotics & Automation | 12.00% |
- Kitchen Management Systems - The Kitchen Management System (KMS) segment, with a share of 20% in 2025, is essential in the U.S. cloud kitchen market as it serves as the digital backbone that automates order routing from various delivery apps, coordinates food preparation across multiple virtual kitchens, reduces labor costs, and monitors real-time inventory to minimize waste.
- Order & Delivery Management Software - Order & Delivery Management Software, with a share of 24% in 2025, is the leading backbone of the U.S. Cloud Kitchen Market. It automates orders from multiple channels, integrates with third-party apps like DoorDash and Uber Eats, manages kitchen preparation, and streamlines delivery from a single dashboard. This technology reduces manual bottlenecks and increases delivery speed.
U.S. Cloud Kitchen Market, By End User, 2025 (%)
| Segments | Shares (%) |
| Startups & Small Enterprises | 30.00% |
| Established Restaurant Chains | 35.00% |
| Delivery Aggregators | 20.00% |
| Catering Services | 15.00% |
- Startups & Small Enterprises - The startups and small enterprises segment, with a share of 30% in 2025, drives the U.S. cloud kitchen market by reducing financial entry barriers, allowing quick testing of niche and ethnic virtual menus, and encouraging significant industry innovation through low-cost operations without the need for expensive physical locations.
- Established Restaurant Chains - Well-known restaurant chains, with a share of 35% in 2025, play a dominant role in the U.S. cloud kitchen market as they ensure consistent high-volume orders, using established brand trust, and rapidly extend their geographic presence without the expensive real estate costs associated with traditional physical locations.
Competitive Landscape
The U.S. cloud kitchen market is rapidly expanding and competitive, fueled by the rising demand for digital food delivery. Key players in this space include CloudKitchens, Kitchen United, REEF Technology, and DoorDash Kitchens. These companies provide shared real estate, integrated delivery logistics, and infrastructure for multi-brand virtual kitchens.
- CloudKitchens offers real estate, its own facility management software, and ready-to-use delivery-optimized setups for independent food operators and growing restaurant chains.
- Kitchen United runs multi-concept ghost kitchen hubs and has a digital ordering platform that allows customers to mix items from various virtual and physical brands in one delivery or pickup order.
- REEF Technology converts urban areas and parking lots into community hubs, using modular "neighborhood kitchens" to accommodate several delivery-only food brands closer to densely populated areas.
- DoorDash Kitchens takes advantage of its leading position in the delivery marketplace by providing kitchen spaces designed for local and national restaurant brands that want to enter new delivery-only markets without the need for full storefront investments.
Segments Covered in the Report
By Type
- Independent Cloud Kitchen
- Commissary/Shared Kitchen
- Restaurant-Branded Cloud Kitchens
- Kitchen Pods
- Aggregator-Owned Cloud Kitchens
By Nature of Operation
- Single Brand
- Multi-Brand
- Hybrid Models
By Cuisine Type
- Fast Food (Burgers, Pizzas, etc.)
- Ethnic Cuisine (Indian, Chinese, Mexican, etc.)
- Health-Conscious & Organic Food
- Gourmet & Premium Offerings
- Others
By Order Source
- Online Food Aggregators
- Restaurant-Owned Platforms/Websites
- Phone Orders
- Walk-in/Takeaway (limited cases)
By Technology Platform
- Kitchen Management Systems
- Order & Delivery Management Software
- POS & Payment Gateways
- Inventory & Supply Chain Software
- Customer Engagement & Loyalty Tools
- AI, Robotics & Automation
By End User
- Startups & Small Enterprises
- Established Restaurant Chains
- Delivery Aggregators
- Catering Services
For inquiries regarding discounts, bulk purchases, or customization requests, please contact us at sales@precedenceresearch.com
Frequently Asked Questions





Ask For Sample
No cookie-cutter, only authentic analysis – take the 1st step to become a Precedence Research client
 Get a Sample




 sales@precedenceresearch.com
 Schedule a Meeting