Asia-Pacific Physical AI Market Trends, Companies, Revenue / Sales Performance, Subscriber Growth, Pricing Strategies, Cloud Adoption, Infrastructure Expansion, Competitive Landscape, and Industry Outlook
Gautam Mahajan is an information and communication technology (ICT) sector researcher and analyst. The analyst covers autonomy levels, integration of AI technology, government investment, and new Physical AI applications in Asia-Pacific. Their research is utilized by robotics manufacturers, technology companies, semiconductor suppliers, investors, and industrial organizations for competitive benchmarking and strategic planning. The Asia-Pacific physical AI market is estimated to reach USD 1,032 billion by 2035.
Source: https://www.precedenceresearch.com/asia-pacific-physical-ai-market
 Get a Sample
 Table Of Content


Asia-Pacific Physical AI Market Size and Forecast 2026 to 2035
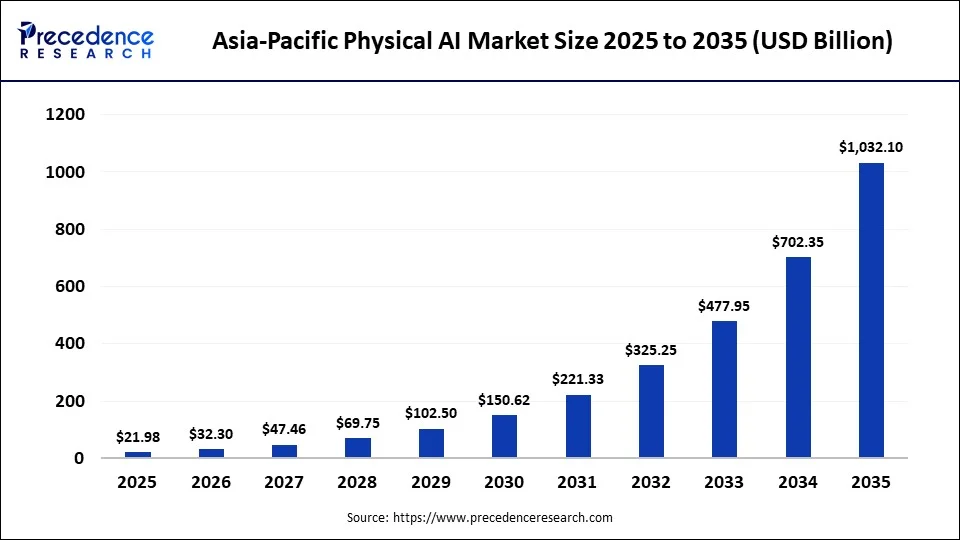
According to Gautam Mahajan, physical AI is about to undergo a big transformation as AI starts to interact with the physical world and no longer just digital environments. Systems that can sense, reason, and act physically are increasingly becoming part of manufacturers and other industries, due to rapid advancements in humanoid robotics, autonomous mobile robots, industrial automation, computer vision, machine learning, and generative AI. Asia-Pacific physical AI is expected to grow to USD 1,032.10 billion by 2035, with a modeled 10-year growth of nearly 46.9 times from its 2026 value of USD 32.30 billion. The analyst sees the entry of fully autonomous systems, growing humanoid robot use, and growing manufacturing processes driven by AI and robust government investment and support in robotics and AI as key drivers of market growth. China is the dominant regional force as it boasts the largest industrial robot deployment, investments under state guidance, and the growing humanoid robotics ecosystem in the region, and India is one of the quickest-growing markets in the region.
Top Findings Before the Detail
- The market is expected to increase by almost 46.9× during the decade, from $32.30 billion in 2026 to a projected $1,032.10 billion in 2035. This translates to one of the fastest-growing technology sectors in the region.
- Autonomy is rapidly changing. Semi-autonomous systems will be shrinking from 72% to 47% of the market, while fully autonomous systems will be growing above the majority mark, from 28% to 53% of the market.
- The fastest-growing physical AI system category is humanoid robots (58.4% CAGR). They will re-rate the category by three times, from 5% to 15% by 2035.
- In 2024, China deployed some 295,000 industrial robots, representing 54% of the world's total installed base and nearly nine times the number of robots installed in the United States.
- South Korea has the highest ratio of robots to manufacturing workers (1,220 robots per 10,000 manufacturing workers). This is over 2.7 times the Asia-Pacific average of 131 robots.
- India has the highest CAGR of 50.7% in the market. It's also the only major economy to be gaining market share, rising from 10% to 14% of the regional market.
- The national state and quasi-state capital dedicated ~$138B (1-trillion-yuan) national venture fund to AI and robotics in China. This is much higher than the recorded amount of private investment in the field, at USD 12.4 billion in 2025.
- China has received 69.7% of the world's AI patent grants, and South Korea leads the world in AI patents per capita. This indicates that different countries lead in patent volume and innovation density.
- Generative AI is the fastest-growing among the Physical AI tech categories, growing at a 53.8% CAGR, and driving growth from 8% to 13% share. It is expanding at a faster rate than the two biggest incumbent technologies, including computer vision and machine learning.
- In August 2026, Unitree Robotics went public with a valuation of USD 9 billion in Shanghai. The company sold around 5,500 humanoid units with a gross margin of about 60% in 2025, providing the first public-market transparency based on humanoid robot economics.
Market Overview
Where Software Learns to Move Through the Physical World
Physical AI refers to a combination of computer vision, sensor fusion, reinforcement learning, and generative models with robots, vehicles, and industrial machines. It undergoes various stages, from research demos to procurement line items, across the Asia-Pacific. The region's physical AI sector totaled $21.98 billion in 2025, which remains low compared with global AI infrastructure spending.
However, its 46.95% CAGR is among the fastest of any technology category tracked anywhere, reflecting three forces converging at once, including China's manufacturing scale and state-directed capital, an aging workforce across Japan and South Korea that makes automation a demographic necessity rather than an efficiency choice, and a wave of humanoid and embodied-AI startups moving from prototype to commercial shipment faster than most forecasters expected.
Key Insight: Asia-Pacific accounted for 74% of all new industrial robot installations worldwide in 2024. The region is the world's center of gravity for physical automation, and Physical AI is the software and intelligence layer being built on top of that existing installed base.
Ten-Year Trajectory: $21.98B - $1,032.10B
The Asia-Pacific physical AI market is estimated to grow from USD 21.98 billion in 2025 at 46.95% CAGR to reach USD 1,032.10 billion by 2035. This is an astounding gain of 46.9 times over the past ten years. The true story, however, is the mathematically modeled path between these two points, and the market's speed along the way during the forecast period. The market expands at a rate of almost 47% CAGR, meaning the market value of the product triples every two to three years.
The result is that more than 85% of the total value creation over the 10 years is done in the second half of the forecast period, between 2030 and 2035, rather than in the first half. This is an inherent effect of high-rate compounding and skewed growth. It also emphasizes the need to continually update market estimates, as a market size measure once used might soon be obsolete, rendering an investment or strategic determination invalid. Even with a 24-month time lag between forecasts, this can result in a significant difference in market opportunity at this rapid pace of growth.
Key Insight: The market doubles in value roughly every 2 to 3 years here, which is fast enough to make a static forecast obsolete; anyone who holds it for more than 2 years is bound to be stale. This becomes obsolete on a 2-year time frame rather than a multi-year one.
Source: Precedence Research Database
Regional Analysis
Country Market Share, 2025 vs. 2035
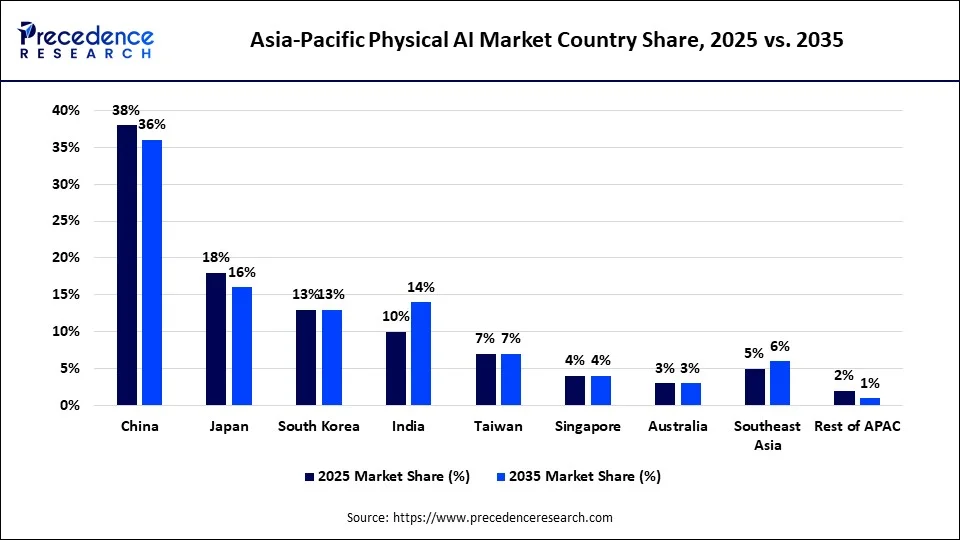
The large manufacturing footprint of China continues to make it the largest physical AI market in Asia-Pacific for the forecast period. However, its market share is projected to contract slightly from 38% in 2025 to 36% by 2035, as its more rapidly growing markets like India and the Southeast Asia region will grow from a lower base. While the share of the Japanese market is expected to decline from 18% to 16% during the same period, Japan will still be the second-largest country market. The market share of South Korea is in the range of 13%, and that of Taiwan is the same at 7%. Singapore and Australia also have relatively mature physical AI markets with 4% and 3%, respectively.
The biggest swing is in India's share, rising from 10% in 2025 to 14% by 2035, gaining four percentage points in the process. At the same time, Southeast Asia improves its share of the market from 5% to 6%, while the Rest of APAC shrinks from 2% to 1%. Overall, the outlook for the country level indicates the market will remain dominated by China, although this can be expected to become more balanced in the coming years as emerging markets gain an increasing share of future physical AI investment and deployment.
Key Insight: China remains the biggest country market in the forecast, losing two points of market share along the way, but India is the only country in the dataset that will gain significant ground, picking up four points by 2035.
Source: Precedence Research Database
Country Growth Momentum (CAGR Ranking)
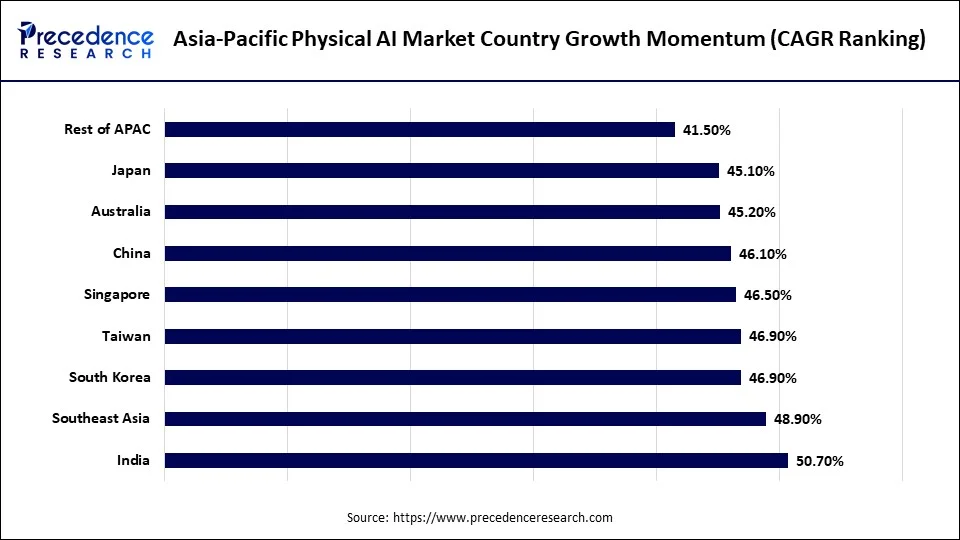
The physical AI market is experiencing the highest level of growth in the Indian market, rising from 10.0% market share in 2025 to 14.0% by 2035. It also shows the highest CAGR of 50.7%, which has been fueled by the rapid growth of manufacturing, digital infrastructure, and growth in AI investments. Southeast Asia accounts for 48.9% CAGR, and the region has seen an increase in manufacturing activity and technology adoption in emerging economies. China continued to be the biggest country market in 2025, representing a 38.0% share of the region, benefiting from a long-standing manufacturing infrastructure, broad deployment of robotics, and substantial investments in AI infrastructure. Its share is projected to drop to 36.0% by 2035, but China has a strong 46.1% CAGR, so it will still lead the way throughout the forecast period.
The company's second-largest portion was Japan with 18.0% due to its high manufacturing strength and advanced robotics and automation technologies. It is expected to grow its market by a CAGR of 45.1% throughout the forecast period. South Korea has 13.0 % and is projected to expand by 46.9 % with the country's strengths in semiconductors, electronics, automotive manufacturing, and robotics. The percentage of market share stood at 7.0% for Taiwan, whose semiconductor manufacturing ecosystem and high level of automation ensured a CAGR of 46.9%.
Smart logistics, digital infrastructure, and government initiatives on AI also ensure that Singapore has good momentum at 46.5% CAGR. Australia also features a 3.0% market share in both 2025 and 2035, with an expected 45.2% CAGR growth in the physical AI market, driven by opportunities in mining, agriculture, and autonomous systems. The Rest of APAC is the slowest-growing region during the forecast period, with a share of 1.0% to 2.0% and 41.5% CAGR.
Key Insight: India is the only country seeing strong market share growth and the fastest CAGR (50.7%), presenting the strongest signal of growth at the country level through to 2035.
Source: Precedence Research Database
Physical AI & Enterprise AI Adoption Across Asia-Pacific
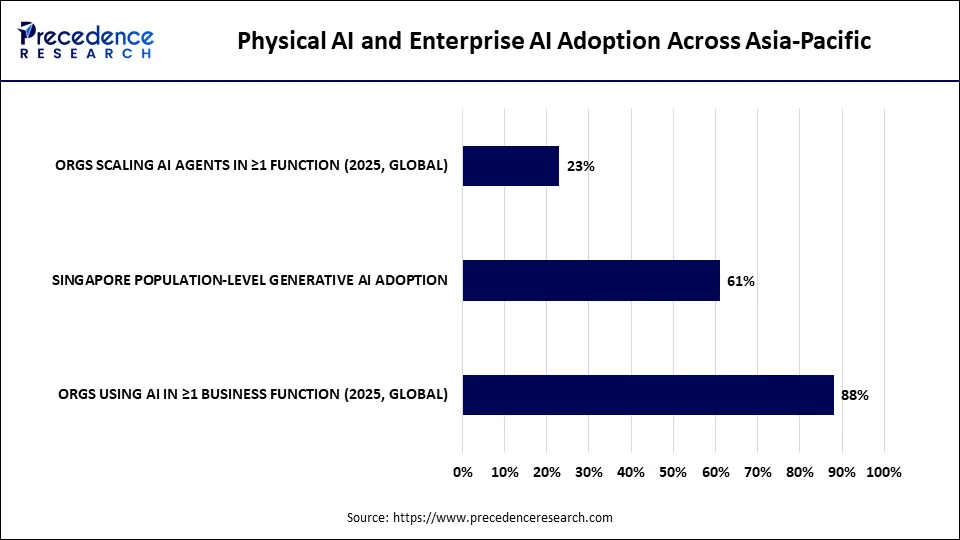
Aman believes that the adoption of enterprise AI is widespread and expanding rapidly globally, and as adoption spreads, so do the numbers of those adopting it tomorrow. The 2025 State of AI survey by McKinsey revealed that 88% of companies worldwide reported using AI in at least one business process. This is a significant increase from 78% a year ago, indicating how rapidly enterprise AI adoption has progressed from experimentation to the mainstream over the course of just one year. Separately, Stanford's AI Index research found that Singapore had one of the top generative AI adoption rates by population, at 61%. This applies on a consumer basis, rather than specifically to enterprise adoption. In addition to these two, there were approximately 23% of organizations worldwide that were already scaling AI agents in at least one business function by 2025. The three numbers are for reference.
Key Insight: General enterprise AI adoption has already crossed 88% globally, and Singapore's consumer generative AI adoption sits at 61%, which shows AI trends in Asia Pacific.
SOURCE: McKinsey, "The State of AI: Global Survey 2025"; Stanford HAI, "The 2026 AI Index Report."
Physical AI Deployment Volume: The Humanoid Proof Point
According to my research, in 2025, Unitree shipped about 5,500 humanoid robot units, with total revenue of approximately 1.7 billion yuan, between 235 and 247 million US dollars, at a gross margin of around 60%. This gross margin is actually more in line with a mature, established category of commercial hardware companies rather than the thin or negative margins. That would be expected in an early-stage hardware category that's still getting its manufacturing model established and working out its costs. This indicates commercial product status that's available for any given manufacturer of humanoid robots, at least for one manufacturer.
Key Insight: Unitree's shipment volume quadrupled year over year and margins were similar to mature hardware companies. This is probably as good a sign as any that humanoid robots have, at least for one named manufacturer, moved from demo to real product on the commercial market.
Source: Precedence Research Database
Industrial Robot Installations in Asia-Pacific
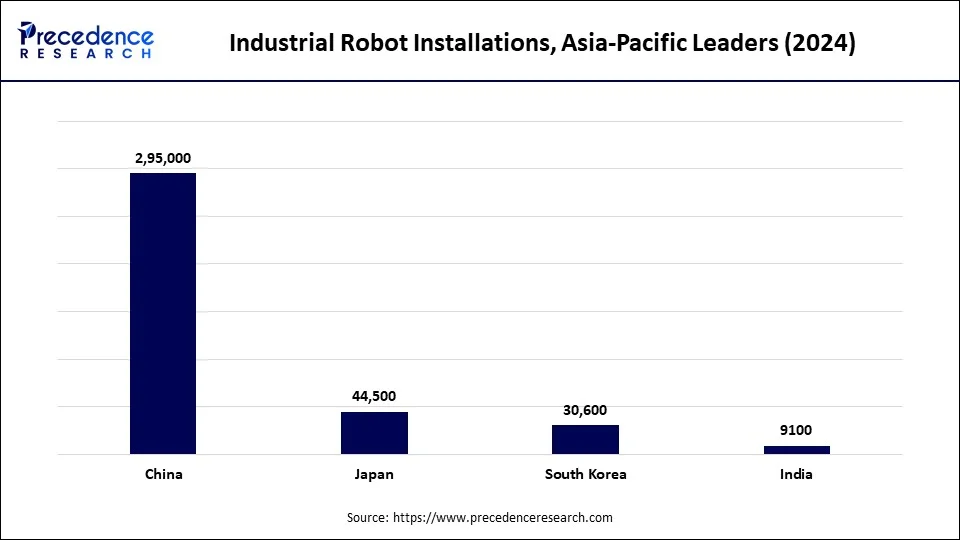
Asia accounted for 74% of all 542,000 industrial robots installed worldwide in 2024. China alone accounted for 54% of all installations that year. That is the part of the industrial automation base that physical AI software and intelligence systems are now being built on top of. On the other hand, Japan, South Korea, and India are also adopting industrial robot technology, accounting for 44,500, 30,600, and 9,100 installations respectively.
In 2024 alone, China deployed almost nine times more industrial robots than the U.S. It has more than 2 million robots in use in any one country in the world by a wide margin. That's no one-year thing. It mirrors a manufacturing base that has been investing in robotics for more than 10 years. Making China's physical AI buildout atop a physical automation base that no other region, or likely the world, can compete with.
Key Insight: China has almost 2 million operational industrial robots, more than any other nation in the world, and has deployed close to 9 times the number of industrial robots that the United States did in one year.
SOURCE: International Federation of Robotics, "World Robotics 2025 Report" (ifr.org/worldrobotics/report-2025).
Annual Growth in Robotics Deployments
| Country | 2024 Installations | YoY Change | Forward Outlook |
| China | 295,000 units | +7% | IFR projects ~10%/year average growth through 2028 |
| India | 9,100 units | +7% | Record year; automotive sector drove 45% of installations |
| Japan | 44,500 units | -4% | Lower single-digit growth expected in 2025, accelerating after |
| South Korea | 30,600 units | -3% |
Installations trending sideways around 31,000/year since 2019 |
Key Insight: The year-over-year installation growth was positive only in China and India, both of which are located in the Asia-Pacific region. The drops in Japan and South Korea are not due to a lack of interest in automation, but rather to market maturity.
Manufacturing Automation Rate: Robot Density
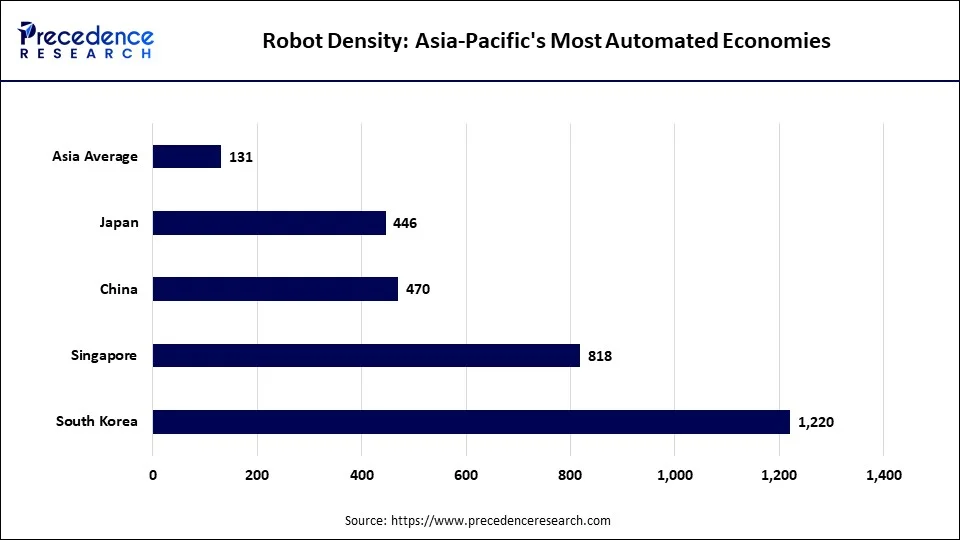
There is considerable variance in the level of automation across Asia-Pacific, with a handful of advanced economies having very high rates of robot deployment. With 1,220 robots per 10,000 manufacturing workers, South Korea is well ahead of the regional average at 131, with Singapore at 818.
The number of robots per 10,000 manufacturing workers was 470 in China and 446 in Japan. Both were higher than the Asia-Pacific average of 131, but lower than South Korea (1,220) and Singapore (818). The China data, for the most recent year available, 2023, was taken from the most recent country-specific data source that was identified for that country. The figures show how market share does not necessarily reflect automation intensity. China and Japan are the dominant countries in the physical AI market, thanks to their manufacturing scale, and South Korea and Singapore have high levels of automation when compared to their economic and population size.
As such, the development of industrial automation is more measured by the benchmarks set by South Korea and Singapore, while the scale of the entire physical AI market is more measured by China and Japan. The simple contrast reveals that there is no direct correlation between how much a country's economy is automated and the share of revenue.
Key Insight: South Korea and Singapore under-index on regional revenue share compared to the level of automation of their economies, which makes it harder to measure the level of automation in this region than by robot density rather than market share.
Source: International Federation of Robotics, "Robot Density Surges in Europe, Asia, and Americas" (Apr 2026); IFR, "Global Robotics Race: Korea, Singapore and Germany in the Lead."
Government & Public Capital Mobilization for AI and Robotics
| Program | Country | Scale | Detail |
| National AI/Robotics VC Fund | China | ~$138B (¥1 trillion) | In March 2025, a 20-year fund was announced to bring local government and private sector investment into robotics, AI, and advanced manufacturing. |
| AI & Robotics Program Commitments | China | ~$140B (2023-2025) | There are several industry trackers that have reported on cumulative committed spending across the various national AI and robotics programs. |
| Beijing Robotics Fund | China (Beijing) | $1.4B | In August 2023, it was announced that the city will provide a fund for robotics R&D, commercialization, and M&A. |
| National Physical AI Robot Strategies | South Korea & Japan | ~100 trillion won combined | In June 2026, both countries introduced their national strategies, which aim for a 20% and 30% share of their respective markets in the global humanoid and AI robot markets. |
| Moonshot R&D Program | Japan | ~$440M (2020-2025) |
Research is receiving funding for humanoid robotics, eldercare, and human-machine symbiosis. |
Key Insight: The USD 12.4 billion that China has revealed it has invested in private AI projects so far in 2025 is still a small fraction of the capital it is committed to investing in the state and quasi-state sector of AI and robotics. Such private-market-driven investment theses may thus underestimate China's true capital investment in the category.
Source: Precedence Research Database
Physical AI Investment and Startup Funding
| Company | Country | Event | Detail |
| Unitree Robotics | China | Shanghai IPO, Aug 2026 | Priced at a USD 9 billion valuation, raising approximately USD 904 million on the STAR Market. |
| UBTECH Robotics | China | Hong Kong listing, Dec 2023 | First humanoid robot maker to go public, and delivered more than 1,000 full-size humanoids in 2025. |
| AgiBot (Zhiyuan Robotics) | China | Hong Kong IPO planned | A domestic Unitree competitor pursuing its own public listing. |
| Galbot | China (Hong Kong) | USD 8 billion government fund partnership, Mar 2025 |
Backed by the Hong Kong Investment Corporation, and launched the HK-Galbot Embodied AI Lab. |
Key Insight: Unitree's IPO valuation of nine billion dollars is based on an expected 2025 revenue of well under 300 million dollars, valuing humanoid robotics more as a hyper-growth software category than a hardware maker, and thus benchmarking all other Asian Pacific humanoid makers on the same multiple.
AI & Robotics Patent Filings in Asia-Pacific
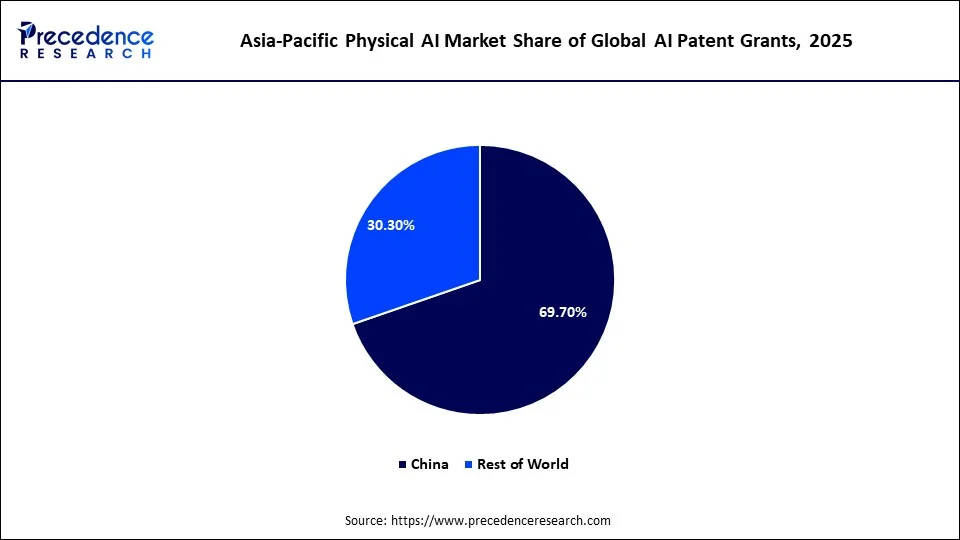
China's share of global AI patent grants is decisive. It held around 69.7% of the global share of patents in 2025. I believe that, by most counts, the world is in terms of AI patents granted, and this is where much of the market's patent momentum lies. The average citation rate across the United States is higher, a point made by Stanford's AI Index that is worth keeping in mind alongside any patent share figure. The most surprising aspect of this data is in the specific data for South Korea.
Despite accounting for only about 1/8 of the AI physical market by revenue. It also suggests that South Korea is a better gauge of where frontier IP is being generated than where near-term physical AI revenue will be focused. It is important to remember that when evaluating patent activity is a proxy for market opportunity, not underlying research strength.
Key Insight: South Korea leads the global rankings for AI patents per capita, and they only account for a modest share of physical AI revenue in the region, so regional physical AI income is a better barometer of where AI frontier IP will focus than regional physical AI revenue will focus.
SOURCE: Stanford HAI, "The 2026 AI Index Report"; MLQ News, "Stanford's 2026 AI Index Reveals China Nearly Eliminates U.S. Performance Lead."
AI Compute Infrastructure Capacity for Physical AI
In all the physical AI systems in this space, the end-to-end compute supply chain is ultimately dependent on a single company. TSMC dominated the global foundry market by the second half of 2025 with a 72% share. Thus, high-performance computing and AI accelerator chips accounted for 61% of its total revenue by the first quarter of 2026. The company plans to produce over 17 million 12-inch wafer equivalents each year.
The reason for that concentration is the entire physical AI hardware roadmap. Both the country and the company developing the robot, autonomous vehicle, or drone depend upon the same foundry if the capacity constraint or geopolitical disruptions are specific to TSMC. They would not be a business-specific risk that's limited to one manufacturer's supply chain. In effect, it would be a systemic risk to the entire regional market.
Key Insight: A disruption at just one foundry, TSMC, would not be a company-specific supply chain issue, given it manufactures nearly every top AI chip globally and brings in 61% of its revenue from AI accelerators.
SOURCE: IndexBox, "TSMC AI Chip Demand: 2025 Performance & 50% Growth Forecast to 2029"; Stanford HAI, "The 2026 AI Index Report" (TSMC foundry dependency finding).
AI Semiconductor Demand and Shipment Volume
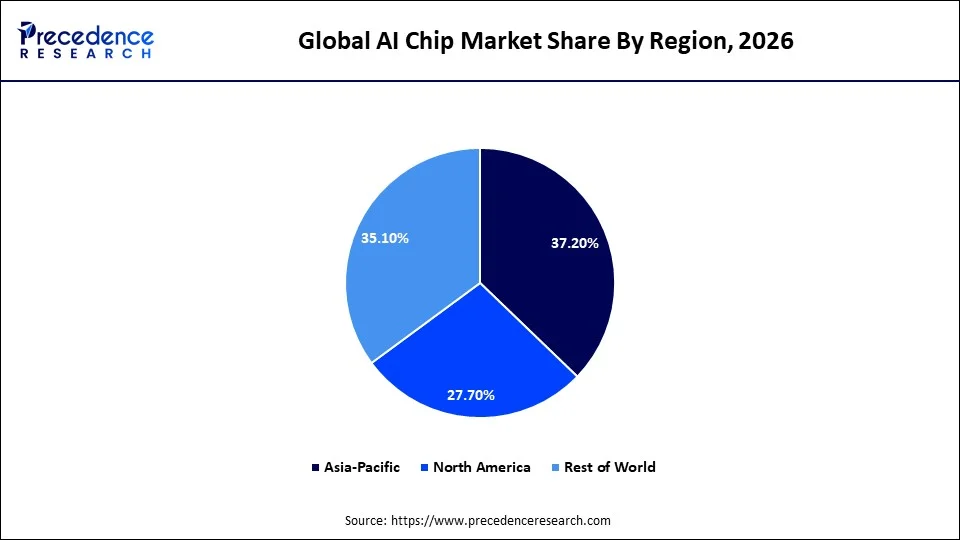
Despite the fact that the majority of the demand for AI chips comes from the creators of AI models in North America. This region's share of the global market is only 27.7%, compared with 37.2% for Asia-Pacific. It's a sign of both the demand for AI chips from end users across consumer electronics, automotive, and industrial applications in the region, as well as the fact that the region is home to chip designers and manufacturers, such as HiSilicon from China, Samsung from South Korea, and TSMC from Taiwan. I interpret that Asia-Pacific is taking a big lead in AI hardware demand, not in the development of cutting-edge AI models, and that's a legitimate competition, with a different winner.
Key Insight: Asia-Pacific has almost ten points more AI chip market share than North America, which, despite the fact that North America is home to key players in the field of AI model development, suggests that the hardware demand and manufacturing scale are a different competition and the region is clearly winning.
Source: Precedence Research Database
Segmental Insights
Autonomy Level: Fully Autonomous Overtakes Semi-Autonomous
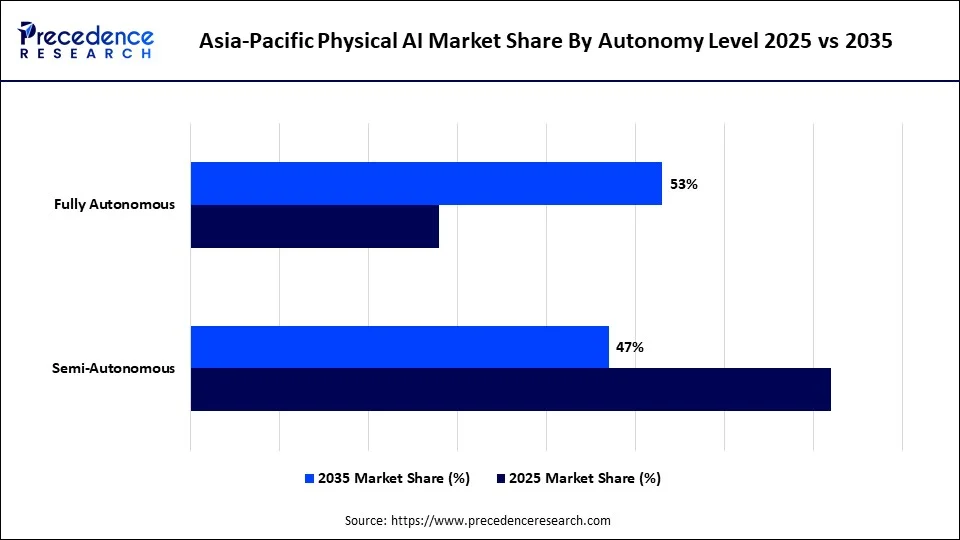
In 2025, 72.0% of physical AI systems were semi-autonomous, indicating the degree of human supervision or human intervention that still exists in the region's physical AI operations. The slowest growth is for semi-autonomous shares, which fall steeply to 47.0% by 2035 at an annual growth rate of 42.2%.
Fully autonomous systems are the systems that are taking over, growing from a 28.0% share in 2025 to 53.0% by 2035, crossing the fifty-percent majority mark before the end of the decade at a 55.2% CAGR. That is more than thirteen points ahead of semi-autonomous systems over the same period. This is by far the biggest shift in structure in this entire market, and a true majority change rather than a gradual loss of market share over a period of 10 years.
Key Insight: Fully autonomous systems make more than a thirteen-point growth compared to semi-autonomous systems, and reach the majority mark of fifty percent by the year 2035. That is, any product or safety certification plan that still considers human supervision as the norm should regard human supervision as provisional, not definitive.
Source: Precedence Research Database
Humanoid Robots: The Fastest-Growing Physical AI System
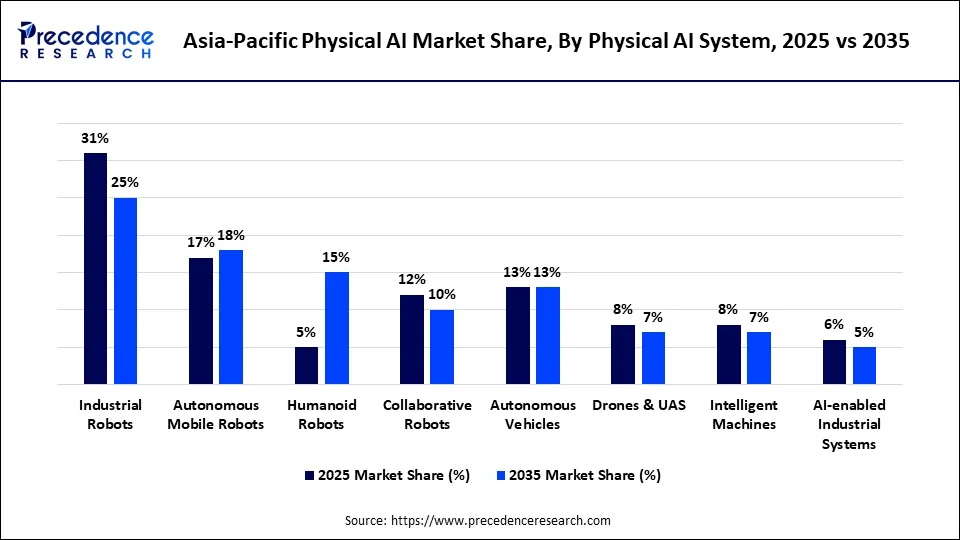
Industrial robots are the biggest physical AI system type for the entire forecast period. However, that advantage will be greatly reduced as the top spot in 2025, with a 31.0% share, will fall to a 25.0% share in 2035, with growth at 43.5% CAGR. It's actually Humanoid robots that are rewriting this category's structure, moving from just a 5.0% share in 2025 to a 15.0% share by 2035, at 58.4% CAGR.
Key Insight: Industrial robots lose six points of share while humanoid robots gain ten over the same decade, and that trade is the segmentation data's clearest confirmation yet of the Unitree, UBTECH, and AgiBot commercialization story documented throughout this report's company-level research.
Source: Precedence Research Database
Technology: Generative AI Is the Fastest-Growing Layer
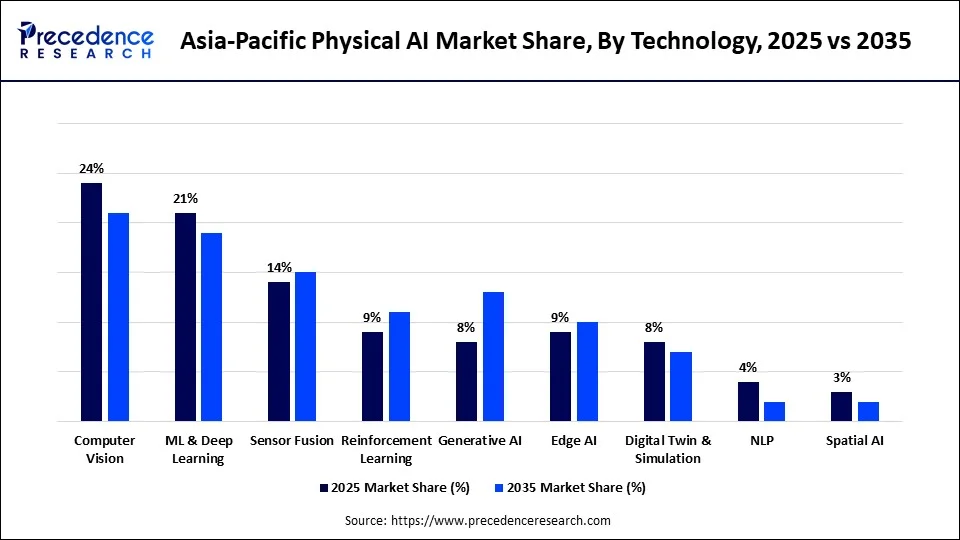
At the heart of every physical AI system is the underlying perception layer. Computer vision took the top share in 2025 and continues to grow by 45.5% to a 21.0% share by 2035. Machine Learning and deep learning accounted for 21.0% in 2025 and will grow to 19.0% by 2035, at 45.8% CAGR.
Despite the loss of some share of the technology mix at the relative level, computer vision and machine learning still make up 40% of the technology mix in 2035. Highlighting that generative AI's rapid ascent is not a replacement for the perception and control stack that physical AI systems are built on, but additive to it.
Key Insight: Computer vision and machine learning will still make up 40% of the mix. This is a story of generative AI being layered on top of the current perception and control stack, not replacing it.
Source: Precedence Research Database
Component: Software Gains Share, Hardware Stays the Base
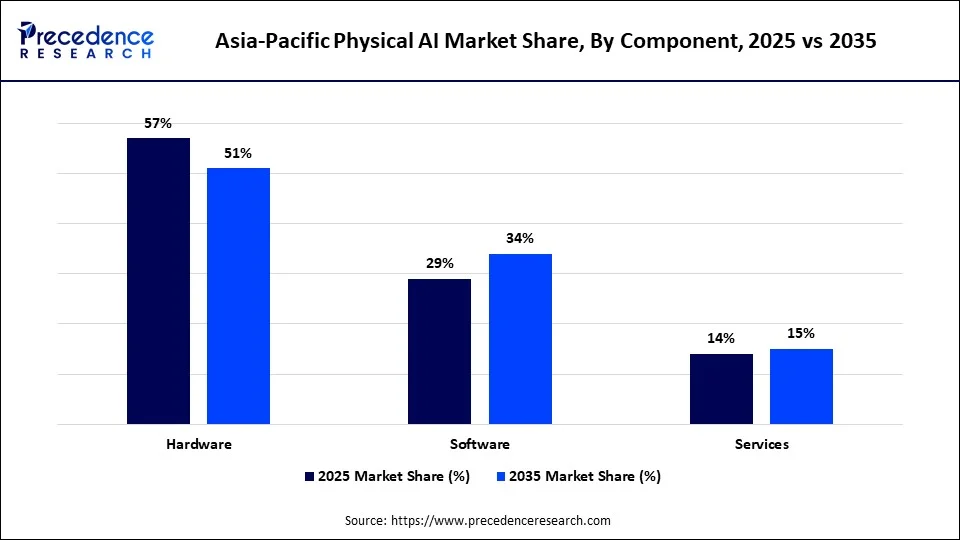
By 2025, hardware held a 57.0% share of the component category. That is expected to continue to dominate the market through 2035 at 45.1% CAGR, even as the share of the category declines. At 48.9% CAGR, the fastest of the three, software is the component that is really gaining ground, from 29.0% to 34.0% share.
But it is necessary to be exact about what that shift actually is, and that hardware in 2035 still has a majority share doesn't mean this is a software vs hardware story, as is sometimes the tech case. The smallest category of services, ranging at 47.8% CAGR, is between hardware and software as it grows from 14.0% share to 15.0% share. Demonstrating that the region continues to see steady demand for integration, maintenance, and deployment services in conjunction with its increasing hardware and software base.
Key Insight: Hardware has a 51% majority in 2035, even as the fastest growth is software, and therefore this is a software catching up to hardware story, much as the region's existing massive installed base of robots needs an intelligent layer placed on top, not a replacement of hardware.
Source: Precedence Research Database
Recent Developments
Mar 2025 - CHINA (NDRC)
China announces ~$138B (1-trillion-yuan) state-backed robotics and AI venture fund
China's National Development and Reform Commission announced that the fund will be a long-term investment with the potential to bring in nearly 1 trillion yuan of investment from local governments or the private sector in the next 20 years. The money will be allocated towards robotics, artificial intelligence and advanced manufacturing.
- WHY IT MATTERS: It is one of the biggest state industrial-policy announcements of AI and robotics by a single country, continuing China's drive towards a 14th Five-Year Plan robotics strategy.
SOURCE: IFR, "China to Invest 1 Trillion Yuan in Robotics and High-Tech Industries" (Mar 2025)
Mar 2025 - GALBOT / HKIC
Galbot secures backing from Hong Kong's $8B government investment fund
Galbot has joined forces with the Hong Kong Investment Corporation to form the HK-Galbot Embodied AI Lab. The project concentrates on humanoid robot applications in retail and tourism, as well as a university training program on embodied AI.
- WHY IT MATTERS: As the industry's development reveals Hong Kong's desire to join the mainstream embodied-AI funding push.
SOURCE: China Briefing, "The Chinese Humanoid Robot AI Market" (Jul 2025)
Sep 2025 - IFR
World Robotics 2025 Report confirms Asia's 74% share of global robot installations
The International Federation of Robotics (IFR) presented its World Robotics report for 2024, revealing that over 542,000 industrial robots were installed worldwide during the year. Asia got 74% of new deployments; China alone got 54%.
- WHY IT MATTERS: The report offers the most accurate annual snapshot of the world and regional robot installation activities and validates the structural advantage of the Asia-Pacific region.
SOURCE: IFR, "World Robotics 2025 Report" (Sep 2025)
Apr 2026 - IFR
Robot density report confirms South Korea, Singapore lead world automation rankings.
South Korea was found to have the highest robot density of 1,220 robots per 10,000 manufacturing workers in IFR's robot density update. The regional average rose 11 per cent to 131, with Singapore second at 818.
- WHY IT MATTERS: The data shows that although absolute growth of installations may be slowing, the degree of automation (density) continues to grow at a rapid pace in the more developed markets across the region.
SOURCE: IFR, "Robot Density Surges in Europe, Asia, and Americas" (Apr 2026)
Jun 2026 - SOUTH KOREA & JAPAN
Korea and Japan launch national Physical AI robot strategies, ~100 trillion won combined
In Physical AI robotics, South Korea and Japan released national strategies to catch up with China. Korea attempts to take a 20% market share in the worldwide humanoid robot market, Japan to take 30% of the worldwide AI robot market.
- WHY IT MATTERS: This is the first time that Korea and Japan have coordinated their national policies toward competing with China in Physical AI, instead of robotics.
SOURCE: Seoul Economic Daily, "Korea and Japan Go All-In on AI Robots" (Jul 2026)
Apr 2026 - TSMC
TSMC's HPC/AI segment hits record 61% of revenue as full-year guidance raised
TSMC had revenue of $35.89 billion in the first quarter of 2026, which is up 40.6% from the same period of the previous year. High-performance computing (AI accelerators) accounted for a record 61% of revenue, and the company's full-year 2026 revenue growth forecast was increased to more than 30%.
- WHY IT MATTERS: The findings reinforce the notion that the compute supply chain driving the roadmap for hardware supporting Physical AI in the region remains robust, albeit with a risk of concentration in the single foundry segment.
SOURCE: IndexBox, "TSMC AI Chip Demand: 2025 Performance & 50% Growth Forecast to 2029"
Aug 2026 - UNITREE ROBOTICS
Unitree prices Shanghai IPO at $9B valuation, China's first mainland-listed humanoid maker
The STAR IPO was priced at 150.8 yuan per share, valuing the company at around 61 billion yuan ($9.04 billion). DeepSeek was also a strategic investor in the offering.
- WHY IT MATTERS: It is the first time a clear, public-market valuation measure for humanoid robotics has been set. Future events like AgiBot and Leju Robotics will likely be judged on this, in their own listings.
SOURCE: CNBC, "Chinese humanoid robot maker Unitree prices IPO at $9 billion valuation" (Aug 2026)
Asia-Pacific Physical AI Market Companies
Unitree Robotics - CHINA
- Role: Humanoid and quadruped robot manufacturer.
- Relevance: Shanghai IPO priced at a $9 billion valuation in August 2026. The company shipped roughly 5,500 humanoid units in 2025 at approximately 60% gross margins.
UBTECH Robotics - CHINA
- Role: Humanoid robotics for industrial and consumer use.
- Relevance: First humanoid maker to go public in Hong Kong in December 2023, and had delivered over 1,000 full-size humanoids in 2025.
AgiBot (Zhiyuan Robotics) - CHINA
- Role: Embodied AI and humanoid robotics.
- Relevance: Leading Unitree challenger; pursuing its own Hong Kong IPO.Galbot
CHINA (HONG KONG)
- Role: Embodied AI robotics for retail and service.
- Relevance: Backed by the $8B Hong Kong Investment Corporation fund; runs HK-Galbot Embodied AI Lab.
Fanuc - JAPAN
- Role: Industrial robots, CNC, factory automation.
- Relevance: One of the world's largest industrial robot manufacturers by installed base.Yaskawa Electric
JAPAN
- Role: Industrial robots, motion control, servo systems.
- Relevance: Core supplier to Asia-Pacific's automotive and electronics manufacturing base.
Rainbow Robotics - SOUTH KOREA
- Role: Humanoid and collaborative robots.
- Relevance: South Korea's biggest humanoid robotics manufacturer, backed by strategic investments from Samsung.
TSMC - TAIWAN
- Role: Semiconductor foundry - AI/HPC chip fabrication.
- Relevance: Manufactures most of the world's top AI semiconductors and had a 72% global foundry market share in H2 2025.
SOURCE: Company disclosures; IFR World Robotics 2025; Stanford HAI AI Index 2026; press coverage cross-referenced across Forbes, CNBC, China Briefing, IndexBox (2025-2026).
Expert Insights
Asia Pacific physical AI market is evolving from traditional automation to intelligent automation. Autonomous systems can perceive, reason, learn, and take action in real-world environments. In a time when manufacturers are looking to become more productive and flexible in how they operate, I believe there are a lot of exciting things happening at the intersection of advanced robotics, edge AI, sensors, computer vision, and high-performance computing. Industrial automation, humanoid robotics, autonomous mobile robots, and AI-driven manufacturing are expected to be critical factors influencing competitiveness in the coming decade.
I'm also anticipating ongoing demand for fully autonomous systems, connected robotics platforms, and AI-powered software to eliminate human limitations on performance and accuracy and to allow systems to operate autonomously. Companies that can integrate scalable hardware, intelligent software, reliable sensing technologies, and a robust distribution network. This will be well placed to benefit from the increasing demand for Physical AI in Asia-Pacific.
Our Experts
Gautam Mahajan is the primary market research, methodology development and market segmentation, regional trend, technology adoption, competition and forecast analysis were the backbone of the report which was led by [Analyst Name].
Aman collected and cross-checked government data, robotics deployment statistics, company financial data, investment announcements, and other quantitative data sources that were independent and enhanced the evidence base that informed the market estimates.
Aditi read through the entire research document, conducted complete quality checks, validated research findings, refined research content, corrected inconsistencies, and finalized the research report, ensuring accuracy and clarity.
Asia-Pacific Physical AI Market Segmentation
By Comonent
- Hardware
- Software
- Services
By Technology
- Computer Vision
- Machine Learning & Deep Learning
- Natural Language Processing
- Sensor Fusion
- Reinforcement Learning
- Generative AI
- Edge AI
- Digital Twin & Simulation
- Spatial AI
By Physical AI System
- Industrial Robots
- Autonomous Mobile Robots
- Humanoid Robots
- Collaborative Robots
- Autonomous Vehicles
- Drones & Unmanned Aerial Systems
- Intelligent Machines & Equipment
- AI-enabled Industrial Systems
By Autonomy level
- Semi-Autonomous
- Fully Autonomous
By Application
- Manufacturing
- Logistics & Warehousing
- Automotive
- Healthcare
- Agriculture
- Construction
- Retail & E-commerce
- Energy & Utilities
- Mining
- Defense & Security
- Consumer & Service Robotics
- Other Applications
By End User
- Automotive & Transportation
- Manufacturing
- Logistics & Supply Chain
- Healthcare & Life Sciences
- Agriculture
- Construction & Infrastructure
- Retail & Consumer Goods
- Energy & Utilities
- Mining & Natural Resources
- Government & Defense
- Other End Users
By Deployment
- Cloud-based
- Edge-based
- Hybrid
By Country
- China
- Japan
- South Korea
- India
- Taiwan
- Singapore
- Australia
- Southeast Asia
- Rest of Asia-Pacific
Questions This Report Deliberately Leaves Open
- What is the most appealing physical AI system category for a new investor in manufacturing in APAC to get into, if investing in the region at all?
- What's the equation for a component supplier pricing for a transition from Hardware (57%-51%) to Software (29%-34%) without compromising on today's installed-base revenue?
- What are the two to three Southeast Asian markets that have both manufacturing relocating tailwinds and regulatory environments that are clear and good to invest in for Physical AI deployment?
- Would the Chinese government's $138 billion subsidy be uninvestable for the foreign investor, or is there a potential co-investment opportunity?
- How long will it take to reach the day where fully autonomous systems are the norm, and what safety and regulatory hurdles might lie along the way?
- Would it be appropriate to use Unitree's valuation of $9 billion and its revenue of about $240 million to calculate the valuation of humanoid robotics companies, or is this a market-specific multiple?
- Is Asia-Pacific Physical AI hardware roadmap exposed to one breakout of the single foundry disrupted by TSMC, and how can risk be minimized?
- Who will be the winners among conventional industrial automation vendors, such as Fanuc and Yaskawa, in the battle to grab the Software and Services revenue from the pure-play AI players?
- The June 2026 commitments by both nations to national robot plans represent what might be expected of the future of non-tariff barriers to foreign Physical AI vendors?
- Is the CAGR of 50.7% sustainable for India or is it a base-effect from its market share of just 20.25% in 2025? What would prove the one correct and the other one incorrect?
- In each segment (Healthcare, Agriculture and Construction) with less than 10% market share, which Physical AI applications are cheapest when compared to growth rate?
- With a comparable valuation in the public markets, how should investors compare AgiBot's or UBTECH's valuation to the public or to Unitree's?
- What sort of productivity or labor cost savings would need to be seen before Physical AI ROI assertions start to be viable?
- The top two Asia-Pacific export demand 'end-user' segments, representing 67%, are most vulnerable to a single downturn in export demand in Manufacturing, Logistics and Automotive?
- If component strategies are to be edge-based, which is projected to rise from 46 percent to 50 percent due to latency and data-privacy considerations, should this approach be a core part of the supplier strategy or should the industry continue with a hybrid?
- Vertically integrating semiconductor manufacturers like TSMC and Samsung with Physical AI system makers or supplying them at arm's length?
- What does the lead of over 470 robots per 10,000 manufacturing workers in China, and its still relatively low per-capita GDP, mean for a Western OEM? Are automation levels moving up faster than economic maturity?
- As the fastest growing of all physical AI technologies, what are the most likely physical AI applications to be transformed first by multimodal embodied models, given Generative's 53.8% CAGR?
References
- Precedence Research Database-Asia-Pacific Physical AI Market
Market value, CAGR, and full segmentation/regional share tables (2025, 2035, CAGR by category) supplied directly for this analysis. - International Federation of Robotics-"World Robotics 2025 Report"
https://ifr.org/worldrobotics/report-2025
Data used: global and country-level industrial robot installation figures, 2024. - IFR-"China to Invest 1 trillion Yuan in Robotics and High-Tech Industries"
https://ifr.org/ifr-press-releases/news/china-to-invest-1-trillion-yuan-in-robotics-and-high-tech-industries
Data used: China's $138B state-backed robotics/AI venture fund, announced March 2025. - IFR-"Robot Density Surges in Europe, Asia, and Americas"
https://ifr.org/ifr-press-releases/news/robot-density-surges-in-europe-asia-and-americas
Data used: 2024 robot density figures for South Korea, Singapore, Japan, and the Asia-Pacific regional average. - Stanford HAI-"The 2026 AI Index Report"
https://hai.stanford.edu/ai-index/2026-ai-index-report
Data used: private AI investment (China vs. US), AI patent share, TSMC foundry dependency, Singapore generative AI adoption rate. - McKinsey-"The State of AI: Global Survey 2025"
https://www.mckinsey.com/capabilities/quantumblack/our-insights/the-state-of-ai
Data used: global enterprise AI adoption rate (88% using AI in ≥1 function). - The Robot Report-"IFR: industrial robot deployments have doubled in 10 years"
https://www.therobotreport.com/ifr-industrial-robot-deployments-have-doubled-in-10-years/
Data used: annual installation trend context for Japan, South Korea, India. - Robot Magazine-"Robotics R&D Race: Which Countries Invest the Most in the Future of Robots?"
https://www.robot-magazine.fr/en/robotics-rd-race-which-countries-invest-the-most-in-the-future-of-robots/
Data used: China's cumulative $140B AI/robotics program commitments (2023–2025); Japan's Moonshot Program funding. - China Briefing-"The Chinese Humanoid Robot AI Market"
https://www.china-briefing.com/news/chinese-humanoid-robot-market-opportunities/
Data used: Galbot/HKIC $8B fund partnership; Beijing's $1.4B robotics fund. - Seoul Economic Daily-"Korea and Japan Go All-In on AI Robots"
https://en.sedaily.com/finance/2026/07/01/korea-and-japan-go-all-in-on-ai-robots-launching-100
Data used: Korea and Japan's June 2026 national Physical AI robot strategies. - CNBC-"Chinese humanoid robot maker Unitree prices IPO at $9 billion valuation"
https://www.cnbc.com/2026/08/06/chinese-humanoid-robot-maker-unitree-prices-ipo-at-9-billion-valuation.html
Data used: Unitree IPO valuation, 2025 revenue and shipment figures. - Forbes-"Unitree's IPO Will Set the First Public Robot Valuation Benchmark"
https://www.forbes.com/sites/jonmarkman/2026/07/30/unitrees-ipo-will-set-the-first-public-robot-valuation-benchmark/
Data used: Unitree revenue growth, gross margin, and UBTECH comparison. - IndexBox-"TSMC AI Chip Demand: 2025 Performance & 50% Growth Forecast to 2029"
https://www.indexbox.io/blog/tsmc-sustains-ai-demand-growth-with-72-market-share-in-2025/
Data used: TSMC foundry market share, HPC/AI revenue share, wafer capacity.
Data used: regional AI chip market share (Asia-Pacific 37.2%, North America 27.7%). - Discovery Alert-"China's Lens Humanoid Robot Expansion Drives Industrial Revolution"
https://discoveryalert.com.au/china-lens-humanoid-robot-expansion-2025/
Data used: China manufacturing wage growth context, Japan robotics revenue context. - HR Asia-"South Korea achieves highest robot workforce worldwide"
https://hr.asia/asia-2/south-korea-achieves-highest-robot-adoption-worldwide/
Data used: South Korea robot density driver context (demographic/labor shortage rationale).
For inquiries regarding discounts, bulk purchases, or customization requests, please contact us at sales@precedenceresearch.com
Frequently Asked Questions





Ask For Sample
No cookie-cutter, only authentic analysis – take the 1st step to become a Precedence Research client
 Get a Sample




 sales@precedenceresearch.com
 Schedule a Meeting