U.S. Nanomaterials Market Size is USD 4.52 Billion in 2026
U.S. Nanomaterials Market (By Material: Gold (Au), Silver (Ag), Iron (Fe), Copper (Cu), Platinum (Pt), Titanium (Ti), Nickel (Ni), Aluminum Oxide, Antimony Tin Oxide, Bismuth Oxide, Carbon Nanotubes, Other Nanomaterials; By Application: Aerospace, Automotive, Medical, Energy & Power, Electronics, Paints & Coatings, Other) Industry Size, Share, Growth, Trends 2026 to 2035.


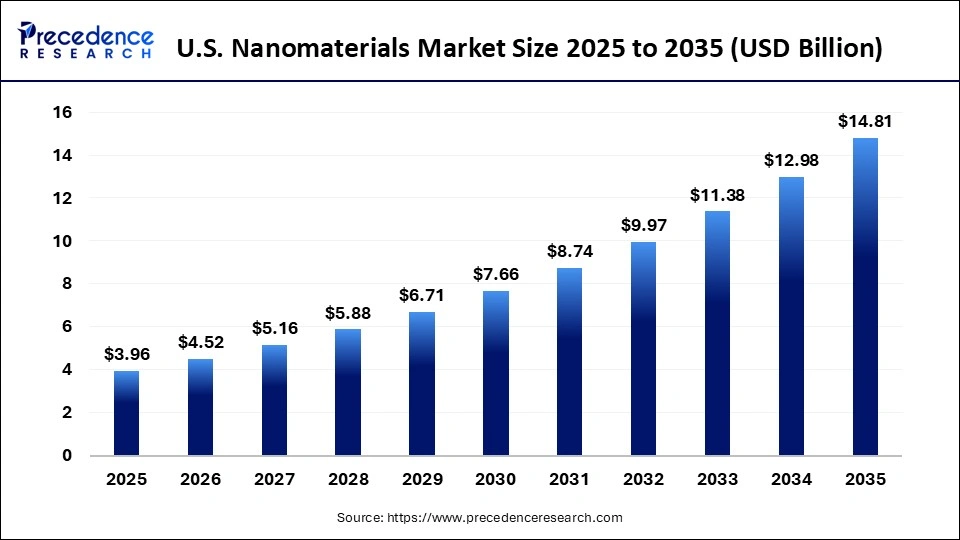
The U.S. Nanomaterials market size was estimated at USD 3.96 billion in 2025 and is expanding at A CAGR of 14.1% from 2026 to 2035. The market is mainly driven by rapid adoption in healthcare, such as drug delivery and cancer treatment, and electronics, such as semiconductors and sensors, as well as strong government support for research and development.
U.S. Nanomaterials Market Statical Scope
| Reports Attributes | Statistics |
| Market Size in 2025 | USD 3.96 Billion |
| Market Size in 2026 | USD 4.52 Billion |
| Market Size by 2035 | USD 14.81 Billion |
| CAGR 2026 to 2035 | 14.1% |
| Base Year | 2025 |
| Forecast Period | 2026 to 2035 |
The U.S. market is vital because of its leading role in high-tech uses, supported by strong research and development. It plays a key part in improving healthcare (like targeted drug delivery and diagnostics), electronics (such as miniaturized semiconductors), and sustainable energy (including efficient batteries and lightweight composites).
This market enhances competitiveness in the aerospace and automotive industries, with notable growth in the medical and coatings sectors. The U.S. is at the forefront of using nanoparticles for targeted cancer treatments and drug delivery, holding a major share in healthcare applications.
It supplies materials like carbon nanotubes and metal oxides that are crucial for next-generation electronics, high-capacity batteries, and supercapacitors. Nanomaterials improve performance in important areas like aerospace, automotive, through lightweighting, and defense. This market is essential for creating green technologies, including advanced catalytic converters, materials for water purification, and efficient solar panels.
The market is projected to continue growing due to increasing demand for advanced nanomaterials such as nanotubes and metal oxides in these key sectors. Significant funding for research and development from both government and private sources fuels rapid innovation and growth, establishing the U.S. as a leading player globally.
U.S. Nanomaterials Market, By Material, 2025 (%)
| Segments | Shares (%) |
| Carbon Nanotubes (CNT) | 25% |
| Titanium (Ti) | 21% |
| Gold (Au) | 35% |
| Silver (Ag) | 19% |
- Carbon Nanotubes (CNT) - The Carbon Nanotubes (CNT) segment, with a share of 25%, plays a vital role in the market as it enables the creation of high-performance, lightweight, and conductive materials needed in rapidly growing sectors such as electric vehicles (EVs), aerospace, defense, and advanced electronics.
- Titanium (Ti) - The Titanium (Ti) segment, with a share of 21%, is the fastest-growing in the U.S. market because of its remarkable strength-to-weight ratio, excellent corrosion resistance, and outstanding UV-blocking/photocatalytic features, making it crucial for aerospace, healthcare (biomaterials), and high-performance coatings.
- Gold (Au) - The Gold (Au) segment, with a share of 35%, is a significant and rapidly expanding part of the Market, mainly due to its unique physicochemical characteristics, excellent biocompatibility, and adaptability in high-end uses like biomedical diagnostics, targeted drug delivery, and electronics.
- Silver (Ag) - The Silver (Ag) nanomaterials segment, with a share of 4%, is important to the market because of its unmatched antimicrobial properties in healthcare (catheters, wound care) and excellent electrical conductivity in electronics, including conductive inks, wearable tech.
U.S. Nanomaterials Market, By Application, 2025 (%)
| Segments | Shares (%) |
| Medical | 39% |
| Paints & Coatings | 25% |
| Aerospace | 23% |
| Automotive | 13% |
- Medical – The medical sector, with a share of 39%, plays a key role in the market as it uses nanotechnology to meet unmet clinical needs through targeted drug delivery, advanced diagnostics, and better implant performance.
- Paints & Coatings - The paints and coatings sector, with a share of 25%, is the fastest-growing in the market because it employs nanotechnology to develop high-performance 'smart' coatings that provide excellent durability, self-healing, anti-corrosion, and anti-microbial features. The sector is driven by the automotive, aerospace, and construction industries.
- Aerospace - The aerospace sector, with a share of 23%, is important to the U.S. market as it creates demand for lightweight, strong, and durable materials that enhance fuel efficiency, lower emissions, and improve structural performance in aircraft and air defense systems .
- Automotive - The automotive sector, with a share of 13%, is a major contributor to the market as it utilizes nanotechnology to comply with strict federal efficiency regulations, enhance safety, and support the shift towards electric vehicles .
Top Companies in the U.S. Nanomaterials Market
- Nanocomposix
- Nanoshel LLC
- Strem Chemicals, Inc.
- American Elements
- US Research Nanomaterials, Inc.
- Nanocomposix, Inc.
- SkySpring Nanomaterials, Inc.
- Alcoa
- Quantum Materials Corporation
- Advanced Material Development
Segments Covered in the Report
By Material
- Gold (Au)
- Silver (Ag)
- Iron (Fe)
- Copper (Cu)
- Platinum (Pt)
- Titanium (Ti)
- Nickel (Ni)
- Aluminum Oxide
- Antimony Tin Oxide
- Bismuth Oxide
- Carbon Nanotubes
- Other Nanomaterials
By Application
- Aerospace
- Automotive
- Medical
- Energy & power
- Electronics
- Paints & Coatings
- Other
| Material | 2025 | 2026 | 2027 | 2028 | 2029 | 2030 | 2031 | 2032 | 2033 | 2034 | 2035 |
|---|---|---|---|---|---|---|---|---|---|---|---|
| Gold (Au) | 0.32 | 0.37 | 0.42 | 0.49 | 0.57 | 0.65 | 0.75 | 0.87 | 1.00 | 1.16 | 1.34 |
| Silver (Ag) | 0.48 | 0.55 | 0.63 | 0.73 | 0.83 | 0.96 | 1.10 | 1.27 | 1.46 | 1.68 | 1.93 |
| Iron (Fe) | 0.36 | 0.40 | 0.46 | 0.51 | 0.58 | 0.65 | 0.74 | 0.83 | 0.94 | 1.05 | 1.19 |
| Copper (Cu) | 0.32 | 0.37 | 0.42 | 0.49 | 0.57 | 0.65 | 0.75 | 0.87 | 1.00 | 1.16 | 1.34 |
| Platinum (Pt) | 0.24 | 0.28 | 0.32 | 0.37 | 0.43 | 0.50 | 0.58 | 0.67 | 0.78 | 0.90 | 1.04 |
| Titanium (Ti) | 0.40 | 0.46 | 0.53 | 0.61 | 0.70 | 0.81 | 0.93 | 1.07 | 1.23 | 1.42 | 1.63 |
| Nickel (Ni) | 0.28 | 0.32 | 0.37 | 0.43 | 0.50 | 0.58 | 0.67 | 0.77 | 0.89 | 1.03 | 1.19 |
| Aluminum Oxide | 0.36 | 0.41 | 0.48 | 0.55 | 0.63 | 0.73 | 0.84 | 0.97 | 1.12 | 1.29 | 1.48 |
| Antimony Tin Oxide | 0.24 | 0.28 | 0.32 | 0.37 | 0.43 | 0.50 | 0.58 | 0.67 | 0.78 | 0.90 | 1.04 |
| Bismuth Oxide | 0.20 | 0.23 | 0.27 | 0.31 | 0.36 | 0.42 | 0.49 | 0.57 | 0.66 | 0.77 | 0.89 |
| Carbon Nanotubes | 0.56 | 0.64 | 0.74 | 0.86 | 1.00 | 1.15 | 1.33 | 1.54 | 1.78 | 2.06 | 2.37 |
| Other Nanomaterials | 0.24 | 0.27 | 0.30 | 0.34 | 0.38 | 0.42 | 0.47 | 0.53 | 0.59 | 0.66 | 0.74 |
| Application | 2025 | 2026 | 2027 | 2028 | 2029 | 2030 | 2031 | 2032 | 2033 | 2034 | 2035 |
|---|---|---|---|---|---|---|---|---|---|---|---|
| Aerospace | 0.48 | 0.55 | 0.63 | 0.73 | 0.83 | 0.96 | 1.10 | 1.27 | 1.46 | 1.68 | 1.93 |
| Automotive | 0.56 | 0.64 | 0.73 | 0.84 | 0.97 | 1.11 | 1.28 | 1.47 | 1.69 | 1.94 | 2.23 |
| Medical | 0.71 | 0.82 | 0.95 | 1.10 | 1.26 | 1.46 | 1.68 | 1.94 | 2.23 | 2.58 | 2.97 |
| Energy & Power | 0.64 | 0.73 | 0.85 | 0.98 | 1.13 | 1.31 | 1.51 | 1.74 | 2.01 | 2.32 | 2.67 |
| Electronics | 0.79 | 0.90 | 1.01 | 1.14 | 1.29 | 1.46 | 1.65 | 1.86 | 2.10 | 2.37 | 2.67 |
| Paints & Coatings | 0.40 | 0.46 | 0.53 | 0.61 | 0.70 | 0.81 | 0.93 | 1.07 | 1.23 | 1.42 | 1.63 |
| Other | 0.40 | 0.43 | 0.47 | 0.50 | 0.54 | 0.58 | 0.61 | 0.65 | 0.68 | 0.72 | 0.74 |
Research Methodology
Related Databooks
March 2026
March 2026
April 2026
April 2026

 sales@precedenceresearch.com
 +1 804-441-9344
 Download Databook
 Schedule a Meeting