


U.S. Cell Separation Market Size, Key Companies, Company Production Capacity, Healthcare Infrastructure Growth, Product Utilization, Regulatory Compliance, Company Expansion Strategies, Company Investment Strategies, and Market Outlook
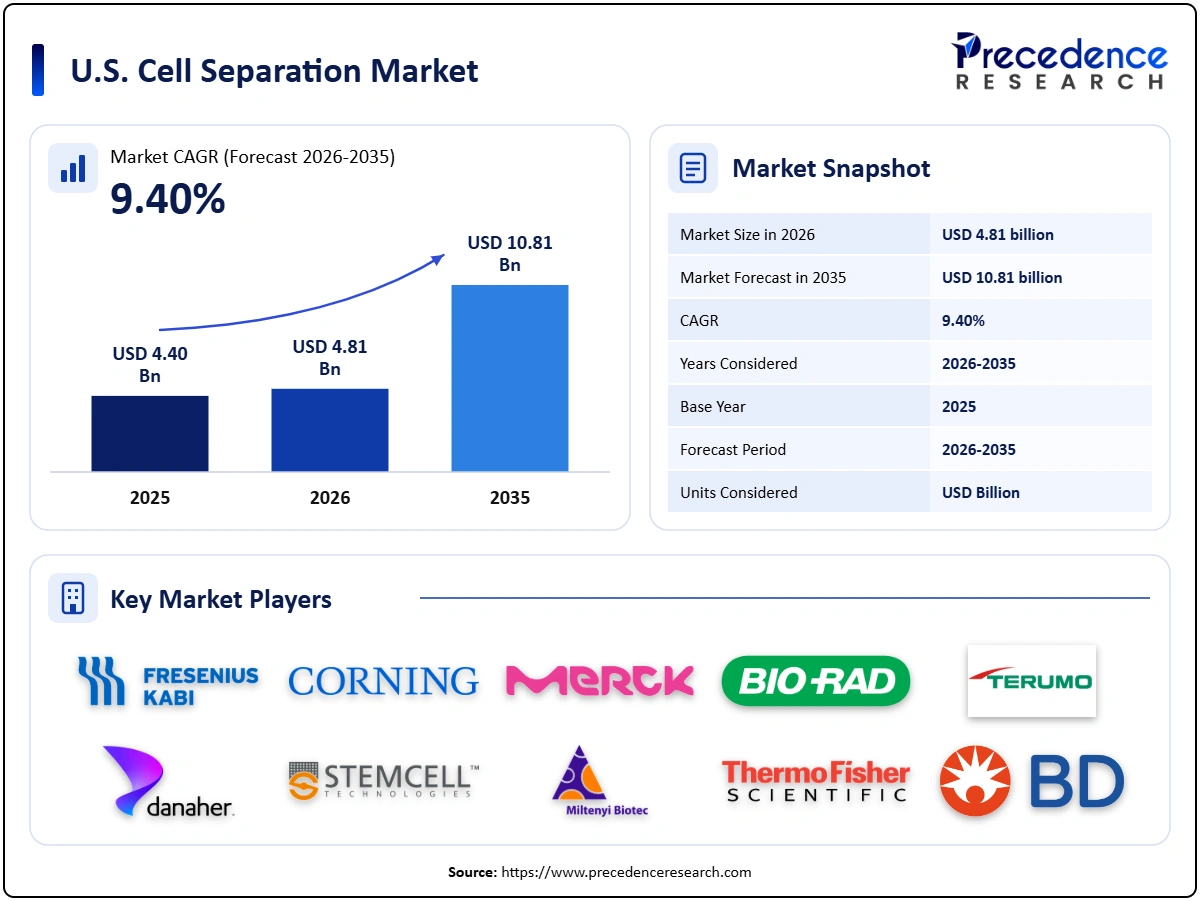
Payal Rabde, a Healthcare Industry Expert, highlights that the U.S. cell separation market has reached USD 4.81 billion in 2026 and is projected to reach USD 10.81 billion by 2035, expanding at a CAGR of 9.40%. Key U.S. cell separation market companies shaping the market include BD Biosciences, Thermo Fisher Scientific, Miltenyi Biotec while major growth segments span product, technique, cell type, application, end user.
Source: https://www.precedenceresearch.com/u-s-cell-separation-market
 Get a Sample
 Report Description
Key Takeaways
Market Size & Growth Outlook
- Market size in 2025: USD 4.40 billion
- Estimated market size in 2026: USD 4.81 billion
- Projected market size by 2035: USD 10.81 billion
- CAGR (2026-2035): 9.40%
Regional Market Spotlight
- Northeast led the market with 33.60%, with a USD 1.48 billion share in 2025.
- West accounted for 27.40% with USD 1.21 billion of the market in 2025.
- South accounted for 25.20% with USD 1.11 billion of the market in 2025 and is projected to be the fastest-growing region, at a CAGR of 9.98% from 2025 to 2035.
Segmental Spotlight
- By product, the consumables accounted for 63.40% with USD 2.79 billion in 2025.
- By technique, the centrifugation accounted for 42.60% with USD 1.87 billion in 2025.
- By cell type, the human cells accounted for 52.40% with USD 2.31 billion in 2025.
- By application, the biomolecule Isolation accounted for 30.60% with USD 1.35 billion in 2025.
- By end user, the biotechnology & Biopharmaceutical Companies accounted for 44.60% with USD 1.96 billion in 2025.
U.S. Cell Separation Market Size and Forecast, 2025-2035 (USD Billion)
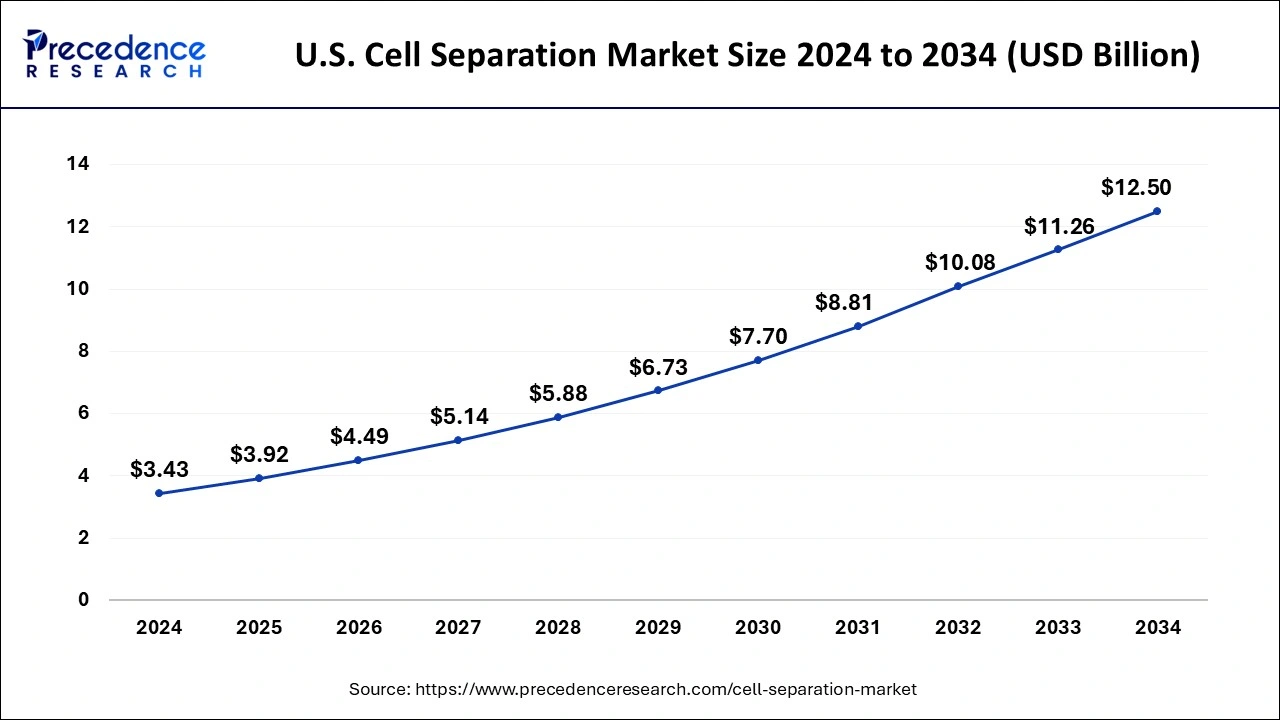
Note: 2025 is the base year; 2026-2035 values are forecasts.
Sources: Expert interviews, secondary sources, Precedence Research database, and Precedence Research analysts.
The U.S. cell separation market is projected to grow from USD 4.40 billion in 2025 to USD 10.81 billion by 2035 because cell therapy manufacturing and biomedical research both depend on isolating specific cell types, and the United States leads the world in both areas. Growth in approved and clinical cell therapies, closed automated processing, single-cell and spatial research, image-enabled sorting, and new label-free technologies support strong growth, lifting the market to USD 6.90 billion by 2030 and sustaining a CAGR of 9.40% from 2026 to 2035.
- Analyst View: We built the estimate from U.S. use of cell separation consumables by application and end user, plus instrument shipments and prices, covering research laboratories, biopharmaceutical companies, cell therapy manufacturers, hospitals, and CROs. Consumable use reflects research funding, cell therapy trial and commercial volumes and diagnostic testing, while instrument sales reflect new laboratory and manufacturing capacity. We cross-checked the total against the U.S. revenues of leading suppliers and published estimates, which places our base year slightly above the highest credible comparable figure. The growth rate is based on evidence from cell therapy growth and research activity, moderated by research budget pressure.
Market Trends
- Closed automated cell processing.
- Image-enabled spectral cell sorting.
- GMP-grade separation reagents.
- Label-free and buoyancy-based separation.
- Single-cell analysis workflows.
- Consolidation among suppliers.
Drivers, Restraints and Opportunities
Driver
Cell therapies need cell isolation. Research funding supports demand. Single-cell analysis grows. Liquid biopsy needs rare cell isolation. Closed systems improve GMP compliance.
Restraint
Instruments are expensive. Research budgets face pressure. Cell therapy costs limit volumes. Purity and recovery trade-offs persist. Skilled operators are needed.
Opportunity
Allogeneic therapies need scalable separation. Automation reduces labour. New technologies improve cell health. Diagnostics adopt rare cell isolation. Service and reagent contracts add revenue.
Market Segmentation: 2025 Share and Size
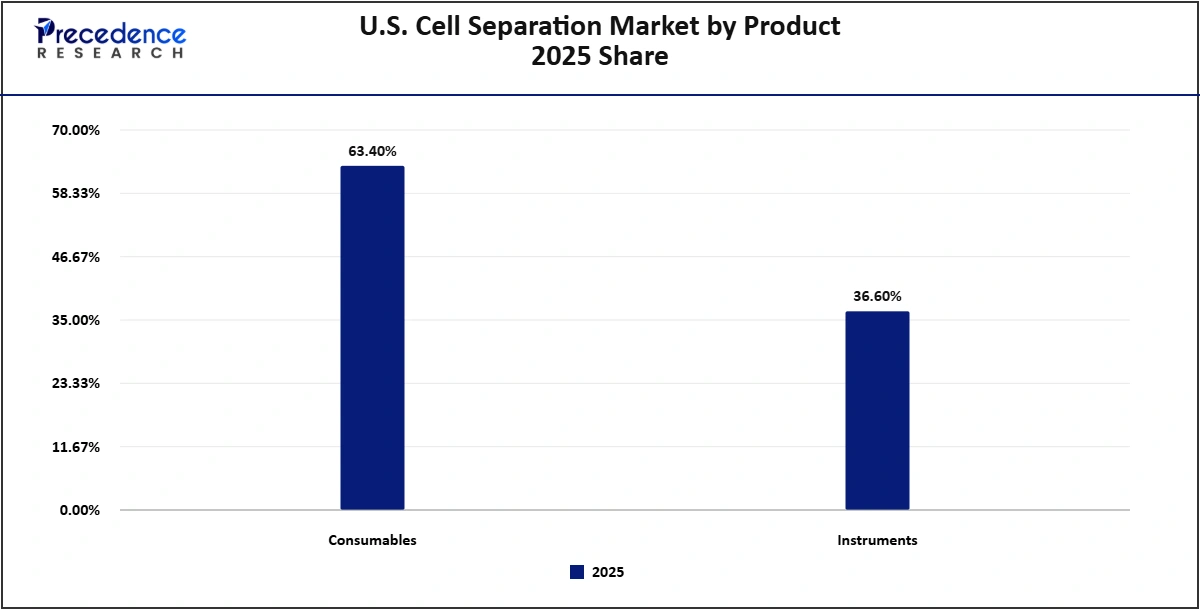
U.S. Cell Separation Market by Product 2025 Share
Note: 2025 is the base year; 2035 values are forecasts.
Sources: Expert interviews, secondary sources, Precedence Research database, and Precedence Research analysts.
Consumables accounted for 63.40% with USD 2.79 billion in 2025, and instruments accounted for 36.60% (USD 1.61 billion). Consumables lead and are growing slightly faster.
Consumables: This segment accounted for 63.40% with USD 2.79 billion of the U.S. cell separation market in 2025 and is projected to reach USD 6.95 billion by 2035, expanding at a CAGR of 9.54% from 2026 to 2035. Consumables include magnetic beads and columns, antibody cocktails, density gradient media, separation tubes, filters, and GMP-grade reagents. They lead because every separation consumes them, and suppliers such as Thermo Fisher (Dynabeads), Miltenyi Biotec (MACS), and STEMCELL Technologies (EasySep) sell large volumes to research and cell therapy users.
Instruments: This segment accounted for 36.60% with USD 1.61 billion of the U.S. cell separation market in 2025 and is projected to reach USD 3.86 billion by 2035, expanding at a CAGR of 9.14% from 2026 to 2035. Instruments include centrifuges, magnetic separators, flow cytometry cell sorters, closed automated cell processing systems, and apheresis devices. Image-enabled spectral sorters and closed systems for cell therapy are raising average prices.
U.S. Cell Separation Market by Technique 2025 Share & Size
| Segments | 2025 Share | 2025 Value (USD Billion) | 2035 Value (USD Billion) | CAGR 2026–2035 |
| Centrifugation | 42.60% | 1.87 | 4.22 | 8.45% |
| Surface Marker-Based Separation | 33.80% | 1.49 | 4.16 | 10.85% |
| Filtration | 14.20% | 0.62 | 1.46 | 8.85% |
| Others | 9.40% | 0.41 | 0.97 | 8.85% |
Note: 2025 is the base year; 2035 values are forecasts.
Sources: Expert interviews, secondary sources, Precedence Research database, and Precedence Research analysts.
Centrifugation accounted for 42.60% with USD 1.87 billion in 2025, surface marker-based separation for 33.80% with USD 1.49 billion, filtration for 14.20% with USD 0.62 billion, and others for 9.40% with USD 0.41 billion.
Centrifugation: This segment accounted for 42.60% with USD 1.87 billion of the U.S. cell separation market in 2025 and is projected to reach USD 4.22 billion by 2035, expanding at a CAGR of 8.45% from 2026 to 2035. Centrifugation, including density gradient separation, is the largest technique because it is the standard first step for isolating mononuclear cells from blood and bone marrow and for cell washing in manufacturing.
Surface Marker-Based Separation: This segment accounted for 33.80% with USD 1.49 billion of the U.S. cell separation market in 2025 and is projected to reach USD 4.16 billion by 2035, expanding at a CAGR of 10.85% from 2026 to 2035. Surface marker-based separation uses antibodies attached to magnetic beads or fluorescent labels to isolate specific cells, such as CD4 and CD8 T cells or CD34 stem cells. It is the fastest-growing technique because cell therapies and immunology research need highly pure, defined cell populations.
Filtration: This segment accounted for 14.20% with USD 0.62 billion of the U.S. cell separation market in 2025 and is projected to reach USD 1.46 billion by 2035, expanding at a CAGR of 8.85% from 2026 to 2035. Filtration separates cells by size and is used for cell washing, concentration, and removal of debris in research and manufacturing.
Others: This segment accounted for 9.40% with USD 0.41 billion of the U.S. cell separation market in 2025 and is projected to reach USD 0.97 billion by 2035, expanding at a CAGR of 8.85% from 2026 to 2035. Others include microfluidic, acoustic, and buoyancy-based separation, such as Akadeum's microbubble technology, which offers gentle, label-free or column-free isolation.
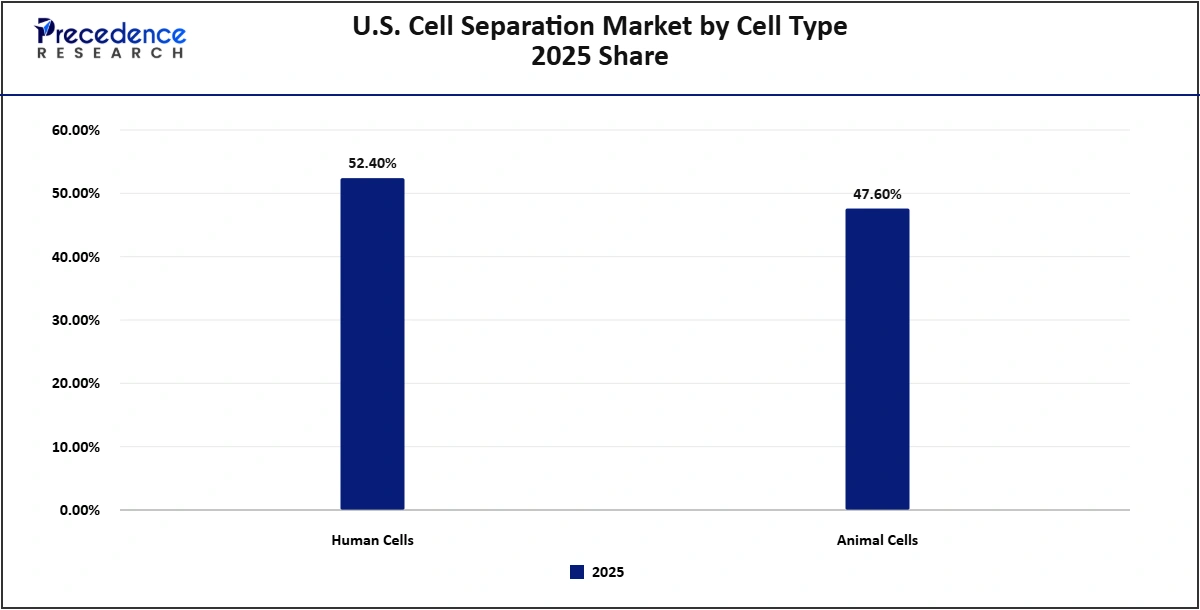
U.S. Cell Separation Market by Cell Type 2025 Share
Note: 2025 is the base year; 2035 values are forecasts.
Sources: Expert interviews, secondary sources, Precedence Research database, and Precedence Research analysts.
Human cells accounted for 52.40% with USD 2.31 billion in 2025, and animal cells for 47.60% (USD 2.09 billion.
Human Cells: This segment accounted for 52.40% with USD 2.31 billion of the U.S. cell separation market in 2025 and is projected to reach USD 5.91 billion by 2035, expanding at a CAGR of 9.87% from 2026 to 2035. Human cells, including blood, immune, stem, and tumour cells, are the larger and faster-growing segment because of cell therapy manufacturing, clinical research, and diagnostics such as circulating tumour cell isolation.
Animal Cells: This segment accounted for 47.60% with USD 2.09 billion of the U.S. cell separation market in 2025 and is projected to reach USD 4.90 billion by 2035, expanding at a CAGR of 8.87% from 2026 to 2035. Animal cells, mainly from mice and other research models, are widely used in basic immunology, oncology, and stem cell research.
U.S. Cell Separation Market by Application 2025 Share & Size
| Segments | 2025 Share | 2025 Value (USD Billion) | 2035 Value (USD Billion) | CAGR 2026–2035 |
| Biomolecule Isolation | 30.60% | 1.35 | 3.10 | 8.69% |
| Cancer Research | 21.80% | 0.96 | 2.29 | 9.09% |
| Stem Cell Research | 17.60% | 0.77 | 1.85 | 9.09% |
| Cell Therapy Manufacturing | 15.60% | 0.69 | 2.06 | 11.59% |
| Immunology Research | 14.40% | 0.63 | 1.51 | 9.09% |
Note: 2025 is the base year; 2035 values are forecasts.
Sources: Expert interviews, secondary sources, Precedence Research database, and Precedence Research analysts.
Biomolecule isolation accounted for 30.60% with USD 1.35 billion in 2025, cancer research for 21.80% with USD 0.96 billion, stem cell research for 17.60% with USD 0.77 billion, cell therapy manufacturing for 15.60% with USD 0.69 billion, and immunology research for 14.40% with USD 0.63 billion.
Biomolecule Isolation: This segment accounted for 30.60% with USD 1.35 billion of the U.S. cell separation market in 2025 and is projected to reach USD 3.10 billion by 2035, expanding at a CAGR of 8.69% from 2026 to 2035. Biomolecule isolation is the largest application, covering isolation of cells to extract DNA, RNA, and proteins for genomics, proteomics, and single-cell analysis.
Cancer Research: This segment accounted for 21.80% with USD 0.96 billion of the U.S. cell separation market in 2025 and is projected to reach USD 2.29 billion by 2035, expanding at a CAGR of 9.09% from 2026 to 2035. Cancer research uses cell separation to isolate tumour cells, immune cells, and circulating tumour cells for studies of tumour biology and immunotherapy.
Stem Cell Research: This segment accounted for 17.60% with USD 0.77 billion of the U.S. cell separation market in 2025 and is projected to reach USD 1.85 billion by 2035, expanding at a CAGR of 9.09% from 2026 to 2035. Stem cell research uses separation to isolate haematopoietic, mesenchymal, and induced pluripotent stem cells.
Cell Therapy Manufacturing: This segment accounted for 15.60% with USD 0.69 billion of the U.S. cell separation market in 2025 and is projected to reach USD 2.06 billion by 2035, expanding at a CAGR of 11.59% from 2026 to 2035. Cell therapy manufacturing is the fastest-growing application because CAR-T, TCR-T, NK, and stem cell therapies require GMP-grade isolation of starting cells, using closed systems such as Miltenyi's CliniMACS Prodigy and Thermo Fisher's CTS platforms.
Immunology Research: This segment accounted for 14.40% with USD 0.63 billion of the U.S. cell separation market in 2025 and is projected to reach USD 1.51 billion by 2035, expanding at a CAGR of 9.09% from 2026 to 2035. Immunology research isolates T cells, B cells, and other immune cells to study immune responses and develop vaccines and immunotherapies.
U.S. Cell Separation Market by End User 2025 Share
Note: 2025 is the base year; 2035 values are forecasts.
Sources: Expert interviews, secondary sources, Precedence Research database, and Precedence Research analysts.
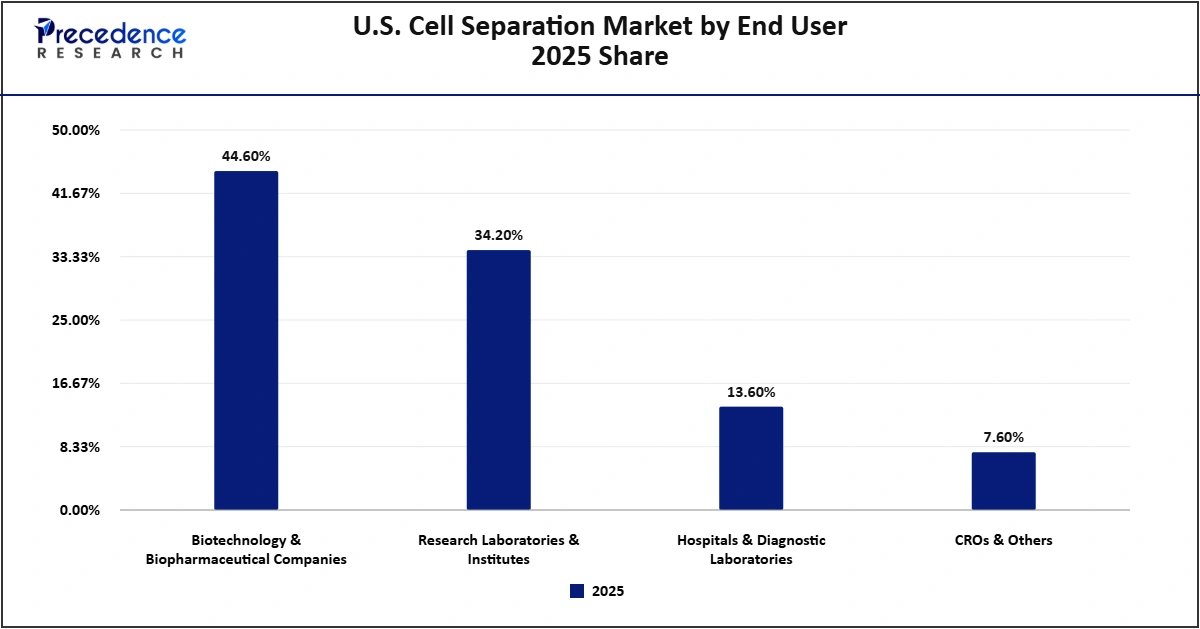
Biotechnology and biopharmaceutical companies accounted for 44.60% with USD 1.96 billion in 2025, research laboratories and institutes accounted for 34.20% with USD 1.50 billion, hospitals and diagnostic laboratories for 13.60% with USD 0.60 billion and CROs and others for 7.60% with USD 0.33 billion.
Biotechnology & Biopharmaceutical Companies: This segment accounted for 44.60% with USD 1.96 billion of the U.S. cell separation market in 2025 and is projected to reach USD 5.03 billion by 2035, expanding at a CAGR of 9.84% from 2026 to 2035. Biotechnology and biopharmaceutical companies are the largest and fastest-growing end users because of cell therapy development and manufacturing and drug discovery.
Research Laboratories & Institutes: This segment accounted for 34.20% with USD 1.50 billion of the U.S. cell separation market in 2025 and is projected to reach USD 3.57 billion by 2035, expanding at a CAGR of 9.04% from 2026 to 2035. Research laboratories and institutes, supported by NIH funding, use cell separation in immunology, oncology, neuroscience, and stem cell research.
Hospitals & Diagnostic Laboratories: This segment accounted for 13.60% with USD 0.60 billion of the U.S. cell separation market in 2025 and is projected to reach USD 1.42 billion by 2035, expanding at a CAGR of 9.04% from 2026 to 2035. Hospitals and diagnostic laboratories use cell separation for stem cell transplantation, apheresis, HLA testing, and liquid biopsy.
CROs & Others: This segment accounted for 7.60% with USD 0.33 billion of the U.S. cell separation market in 2025 and is projected to reach USD 0.79 billion by 2035, expanding at a CAGR of 9.04% from 2026 to 2035. CROs and others include contract research and manufacturing organisations offering cell processing services.
Analyst View: Segment values were allocated by matching consumable use and instrument sales to products, techniques, cell types, applications, and end users, using supplier revenue mixes and research and manufacturing data. Consumables, centrifugation, human cells, biomolecule isolation, and biopharma lead. We expect surface marker separation and cell therapy manufacturing to gain the most share.
Country Analysis
U.S. Cell Separation Market by Country 2025 Share
| Country | 2025 Share | 2025 Value (USD Billion) | 2035 Value (USD Billion) | CAGR 2026–2035 |
| Northeast | 33.60% | 1.48 | 3.50 | 8.98% |
| West | 27.40% | 1.21 | 2.95 | 9.38% |
| South | 25.20% | 1.11 | 2.87 | 9.98% |
| Midwest | 13.80% | 0.61 | 1.49 | 9.38% |
Note: 2025 is the base year; 2035 values are forecasts.
Sources: Expert interviews, secondary sources, Precedence Research database, and Precedence Research analysts.
The Northeast accounted for 33.60% with USD 1.48 billion in 2025, the West for 27.40% with USD 1.21 billion, the South for 25.20% with USD 1.11 billion, and the Midwest for 13.80% with USD 0.61 billion. The Northeast leads, while the South is growing fastest.
Northeast: This region accounted for 33.60% with USD 1.48 billion of the U.S. cell separation market in 2025 and is projected to reach USD 3.50 billion by 2035, expanding at a CAGR of 8.98% from 2026 to 2035. The Northeast includes Boston-Cambridge, New Jersey, and Philadelphia, which host many cell and gene therapy companies, major academic medical centres, and research institutes, making it the largest regional market.
West: This region accounted for 27.40% with USD 1.21 billion of the U.S. cell separation market in 2025 and is projected to reach USD 2.95 billion by 2035, expanding at a CAGR of 9.38% from 2026 to 2035. The West includes the San Francisco Bay Area, San Diego, Los Angeles, and Seattle, with large biotech, immunotherapy, and research communities and cell therapy manufacturing sites.
South: This region accounted for 25.20% with USD 1.11 billion of the U.S. cell separation market in 2025 and is projected to reach USD 2.87 billion by 2035, expanding at a CAGR of 9.98% from 2026 to 2035. The South includes North Carolina's Research Triangle, Texas, Florida, and Maryland, with expanding cell therapy manufacturing, cancer centres such as MD Anderson, and new biomanufacturing investment. It is the fastest-growing region.
Midwest: This region accounted for 13.80% with USD 0.61 billion of the U.S. cell separation market in 2025 and is projected to reach USD 1.49 billion by 2035, expanding at a CAGR of 9.38% from 2026 to 2035. The Midwest includes research universities and medical centres in Illinois, Ohio, Michigan, Minnesota and Wisconsin, and cell separation innovators such as Akadeum in Michigan.
Analyst View: Regional shares were built from research funding, biotech activity, and cell therapy capacity in each region. The Northeast leads because of its dense biotech clusters. We assign the South the highest growth premium because cell therapy manufacturing and research capacity are expanding fastest there.
Competitive Landscape
Top 10 Companies in the U.S. Cell Separation Market, 2025
| Rank | Company Name | Market-Specific Revenue (USD Billion) | 2025 Share | Key Products / Business | Headquarters |
| 1 | BD Biosciences (Waters) | 0.62 | 14.09% | FACS cell sorters and IMag separation | United States |
| 2 | Thermo Fisher Scientific | 0.58 | 13.18% | Dynabeads and CTS cell therapy systems | United States |
| 3 | Miltenyi Biotec | 0.48 | 10.91% | MACS and CliniMACS Prodigy | Germany |
| 4 | STEMCELL Technologies | 0.36 | 8.18% | EasySep and RoboSep | Canada |
| 5 | Danaher (Beckman Coulter and Cytiva) | 0.32 | 7.27% | Cell sorters, centrifuges and Sefia | United States |
| 6 | Terumo Blood and Cell Technologies | 0.22 | 5.00% | Spectra Optia and cell processing | United States |
| 7 | Bio-Rad Laboratories | 0.12 | 2.73% | Cell sorters | United States |
| 8 | Merck KGaA (MilliporeSigma) | 0.12 | 2.73% | Separation media and filters | Germany |
| 9 | Corning | 0.06 | 1.36% | Cell separation consumables | United States |
| 10 | Fresenius Kabi | 0.06 | 1.36% | Lovo and Cue cell processing | Germany |
Note: Company revenues and shares are 2025 estimates.
Sources: Company press releases, expert interviews, secondary sources, Precedence Research database and Precedence Research analysts.
BD Biosciences (Waters) led the U.S. cell separation market with an estimated 14.09% with USD 0.62 billion of 2025 revenue, followed by Thermo Fisher Scientific at 13.18% with USD 0.58 billion and Miltenyi Biotec at 10.91% with USD 0.48 billion. BD Biosciences, which combined with Waters in February 2026, leads through its FACS cell sorters, including image-enabled spectral sorters, and IMag magnetic separation. Thermo Fisher Scientific supplies Dynabeads and CTS cell therapy systems, and Miltenyi Biotec leads magnetic separation with MACS and the CliniMACS Prodigy closed system. STEMCELL Technologies, Danaher, Terumo Blood and Cell Technologies, Bio-Rad, Merck KGaA, Corning and Fresenius Kabi compete through column-free magnetic kits, sorters and centrifuges, apheresis and cell processing, sorters, separation media, consumables and closed cell processing.
The top 10 companies accounted for an estimated 66.82% with USD 2.94 billion of 2025 revenue, while the remaining 33.18% with USD 1.46 billion was shared among specialised separation start-ups, reagent suppliers and regional distributors. The U.S. cell separation market is moderately concentrated, and competition centres on purity and recovery, speed, GMP compliance, closed-system automation, ease of use, regulatory support and cost per separation. Label-free and buoyancy-based start-ups are entering the cell therapy segment.
Companies Ecosystem
The U.S. cell separation ecosystem links antibody and bead producers with instrument makers, cell therapy developers, CDMOs, research institutions and clinical users.
| Ecosystem Stage | Role in the Market | Key Companies |
| Reagents & Antibodies | Supply beads, antibodies and media | Thermo Fisher, Miltenyi Biotec, STEMCELL Technologies |
| Instruments | Supply sorters, separators and closed systems | BD Biosciences, Beckman Coulter, Terumo, Bio-Rad |
| CDMOs & Cell Processing | Run separation in manufacturing | Lonza, Charles River, ElevateBio |
| Research & Clinical Users | Isolate cells for studies and treatment | Universities, hospitals, diagnostic labs |
| Cell Therapy Developers | Use GMP separation | CAR-T, NK and stem cell therapy companies |
Sources: Company press releases, expert interviews, secondary sources, Precedence Research database and Precedence Research analysts.
Precedence Research Companies Quadrant
The Precedence Research Companies Quadrant positions key participants in the U.S. cell separation market by market strength, reflecting revenue scale, market share and geographic reach, and by innovation and growth strategy, reflecting product portfolio breadth, R&D intensity and partnerships. Positions reflect each company's estimated 2025 U.S. cell separation revenue and our assessment of its technology, launches, and partnerships.
Sources: Company press releases, expert interviews, secondary sources, Precedence Research database and Precedence Research analysts.
Leaders: BD Biosciences (Waters), Thermo Fisher Scientific, Miltenyi Biotec, STEMCELL Technologies, Danaher (Beckman Coulter and Cytiva), and Terumo Blood and Cell Technologies combine large U.S. revenue with broad reagent and instrument portfolios and cell therapy solutions.
Innovators: Fresenius Kabi brings closed cell processing systems.
Niche Players: Bio-Rad Laboratories, Merck KGaA (MilliporeSigma) and Corning serve narrower consumable or instrument segments.
Recent Developments
- In February 2026, Waters completed its combination with BD's Biosciences and Diagnostic Solutions businesses, bringing BD's flow cytometry and cell sorting portfolio under Waters.
- In June 2025, Akadeum Life Sciences closed a financing round of more than USD 20 million to expand commercial operations for its buoyancy-based microbubble cell separation technology, including a GMP-compliant product line for clinical cell therapy manufacturing.
U.S. Cell Separation Market Segments
By Product
- Consumables
- Instruments
By Technique
- Centrifugation
- Surface Marker-Based Separation
- Filtration
- Others
By Cell Type
- Human Cells
- Animal Cells
By Application
- Biomolecule Isolation
- Cancer Research
- Stem Cell Research
- Cell Therapy Manufacturing
- Immunology Research
By End User
- Biotechnology & Biopharmaceutical Companies
- Research Laboratories & Institutes
- Hospitals & Diagnostic Laboratories
- CROs & Others
By Country
- Northeast
- West
- South
- Midwest
Research Methodology
The U.S. cell separation market was defined as cell separation consumables and instruments, including magnetic, centrifugation, filtration, sorting, and other techniques for research, diagnostic, and cell therapy use, in the United States. The 2025 base year was built bottom-up from consumable use and instrument sales by product, technique, cell type, application, end user, and region, and checked top-down against the U.S. revenues of leading cell separation suppliers. Segment, regional and company values were allocated from products, techniques, cell types, applications, end users and regional activity.
Key estimates were verified by cross-checking company disclosures, regulatory and industry data and published third-party estimates, and inputs that could not be reconciled were excluded. All segment, regional and company figures were reconciled to the same 2025 base year, and the 2026-2035 forecast, which applies a constant CAGR from the 2025 base, was recalculated and validated.
Analyst View: Overall Market
The U.S. cell separation market is closely tied to the growth of cell therapy and biomedical research, both areas where the United States leads globally. Our estimate links demand to consumable use and instrument sales, so the forecast follows cell therapy volumes, research funding, and adoption of automation. The main upside comes from cell therapy manufacturing, while the main risks are research budget pressure and cell therapy cost challenges.
Sources and References
- Waters Corporation. "Waters Completes Combination with BD's Biosciences and Diagnostic Solutions Businesses". February 2026. Press release. https://www.biospace.com/press-releases/waters-completes-combination-with-bds-biosciences-diagnostic-solutions-businesses
- Akadeum Life Sciences. "Akadeum Lands Major Investment to Fuel Growth in Cell and Gene Therapy". June 2025. Press release. https://www.akadeum.com/news/akadeum-lands-major-investment-to-fuel-growth-in-cell-and-gene-therapy/
For inquiries regarding discounts, bulk purchases, or customization requests, please contact us at sales@precedenceresearch.com
Frequently Asked Questions
Tags





Ask For Sample
No cookie-cutter, only authentic analysis – take the 1st step to become a Precedence Research client
 Get a Sample




 sales@precedenceresearch.com
 Schedule a Meeting