


Blockbuster Oncology Brands Market Size, Key Companies, Company Product Portfolio, Hospital Procurement Trends, Manufacturing Capacity, Sales Performance, Regulatory Approvals, Company Market Share, and Forecast
The blockbuster oncology brands market reached USD 55.16 billion in 2027. The market growth is attributed to the rising cancer prevalence, increasing competition among cancer therapeutics providers, and favorable government support. These trends were analyzed by our Senior Researcher, Deepa Pandey, to curate this report. Her report benefits multiple stakeholders, including biotech manufacturers, R&D, private equity firms, and contract research organizations
Source: https://www.precedenceresearch.com/blockbuster-oncology-brands-market
 Get a Sample
 Report Description


Blockbuster Oncology Brands Market Size, Share, Trends, and Growth Forecast 2036
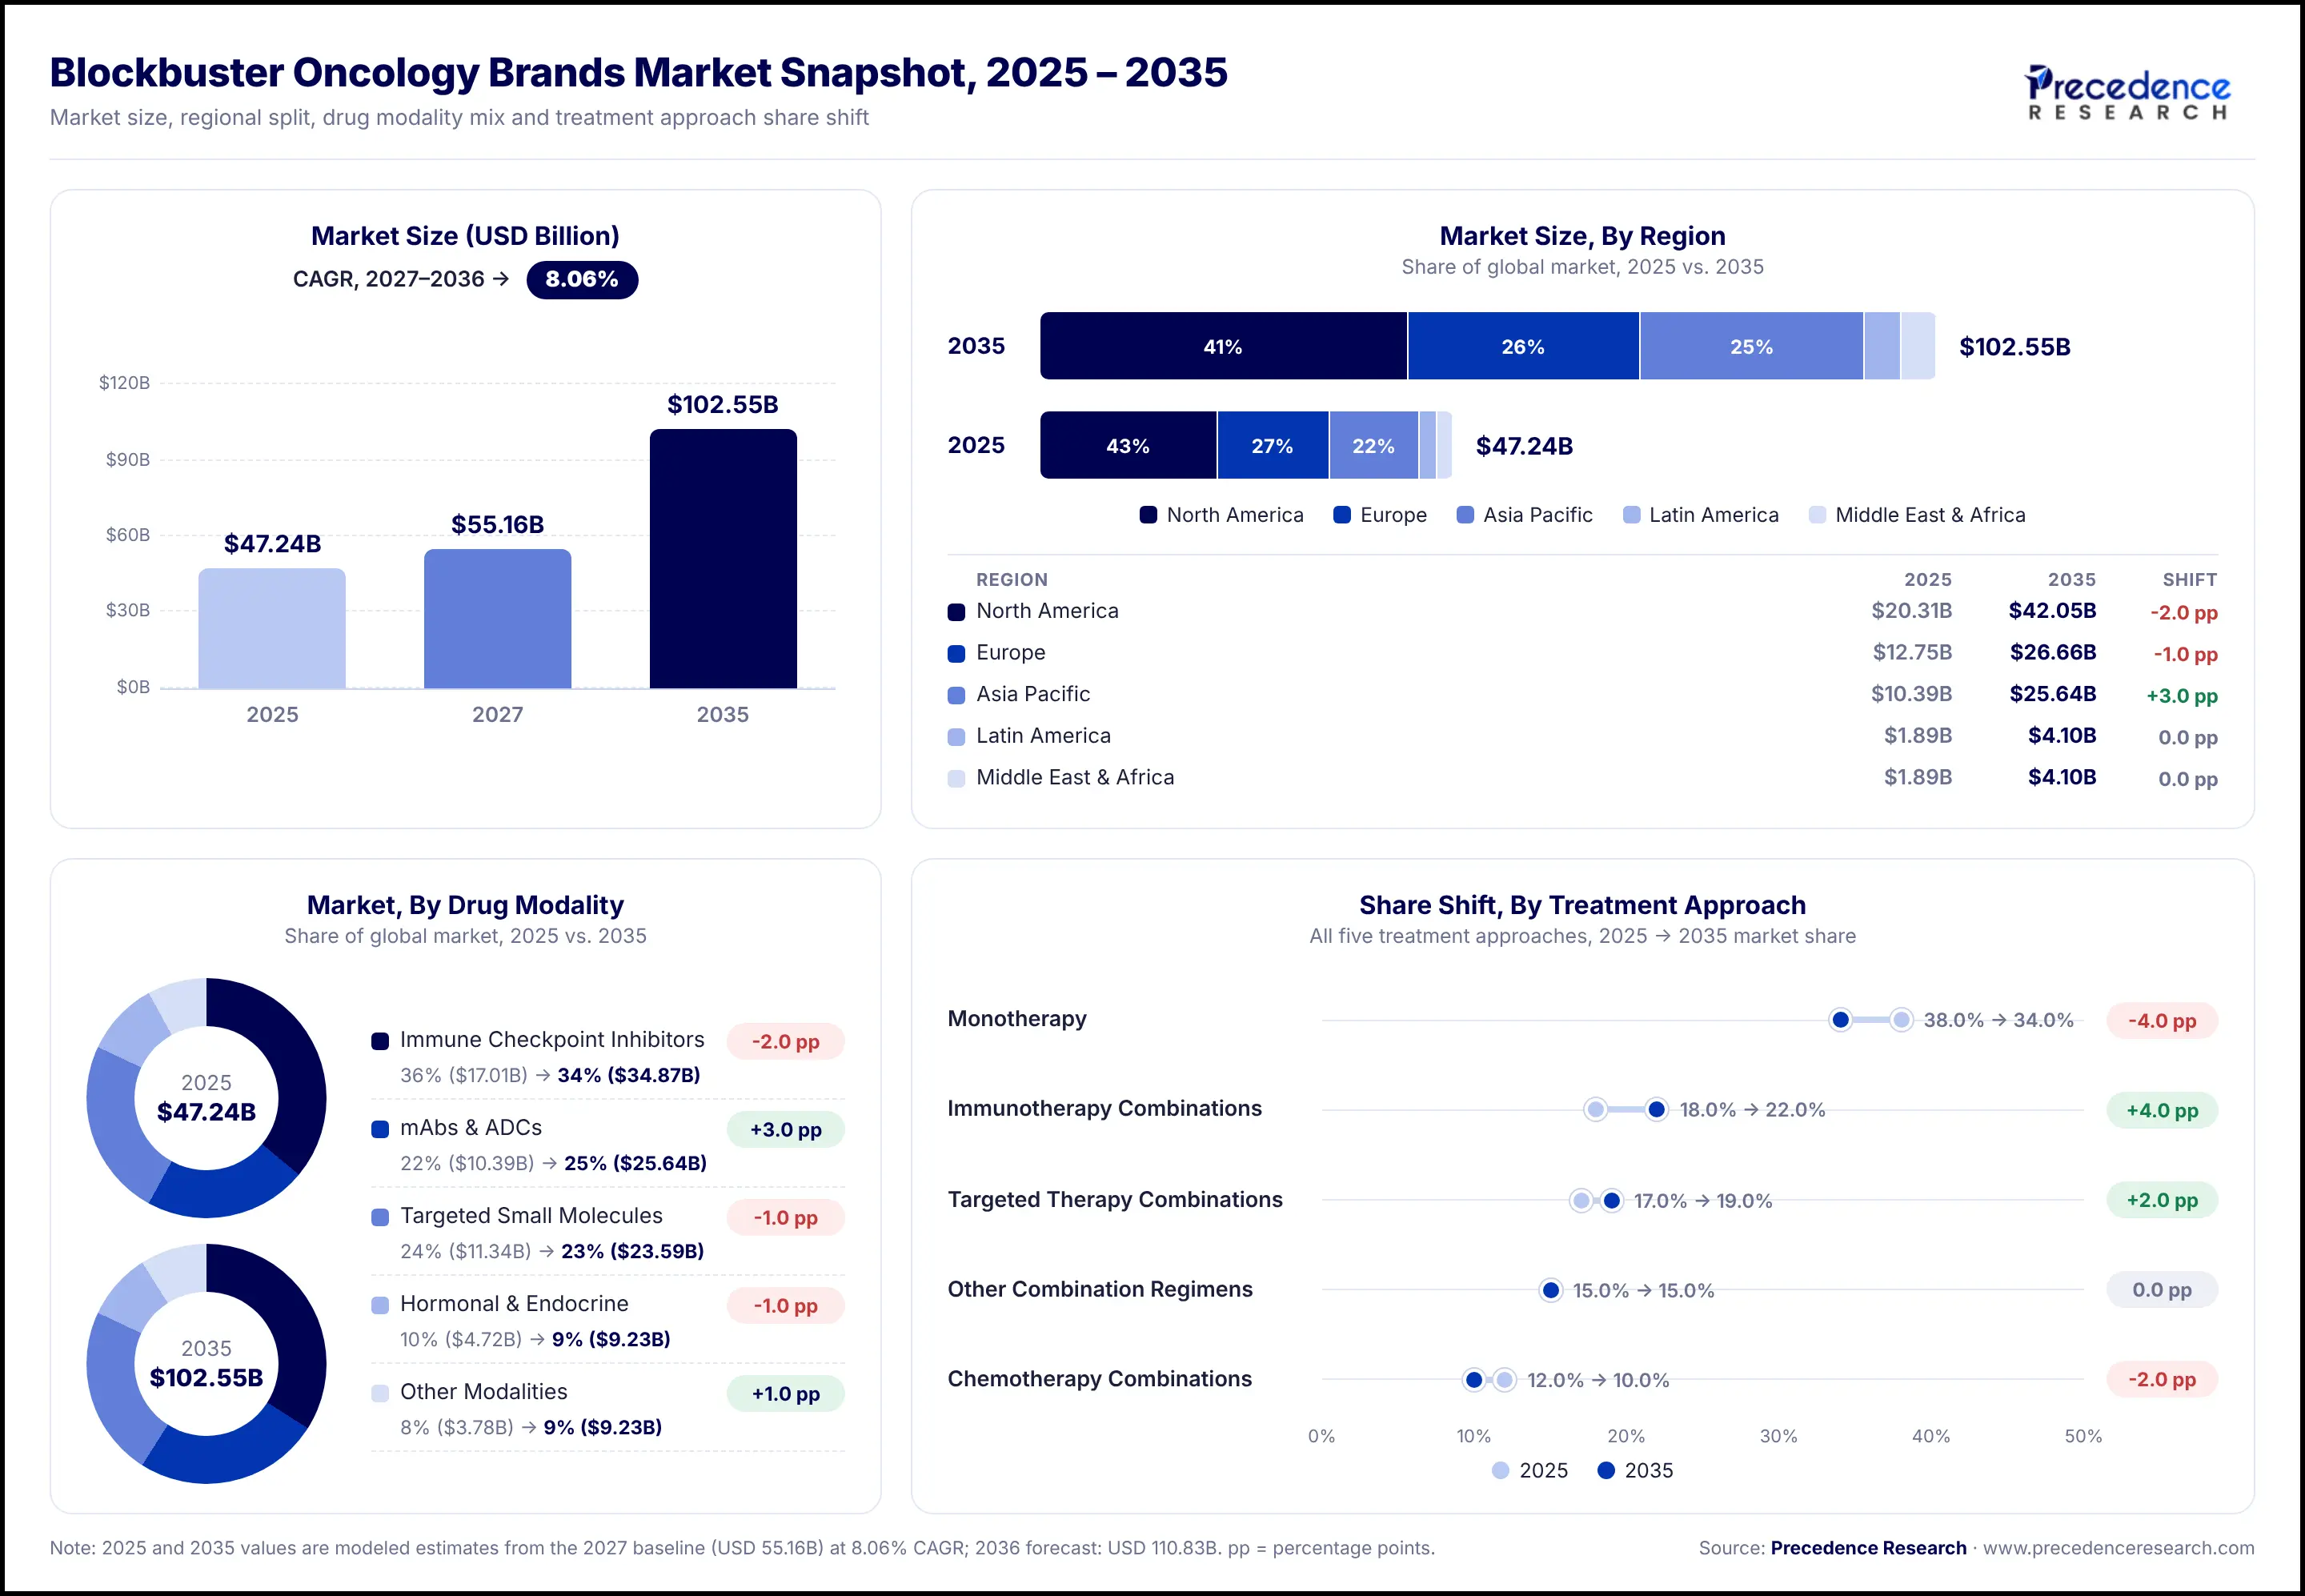
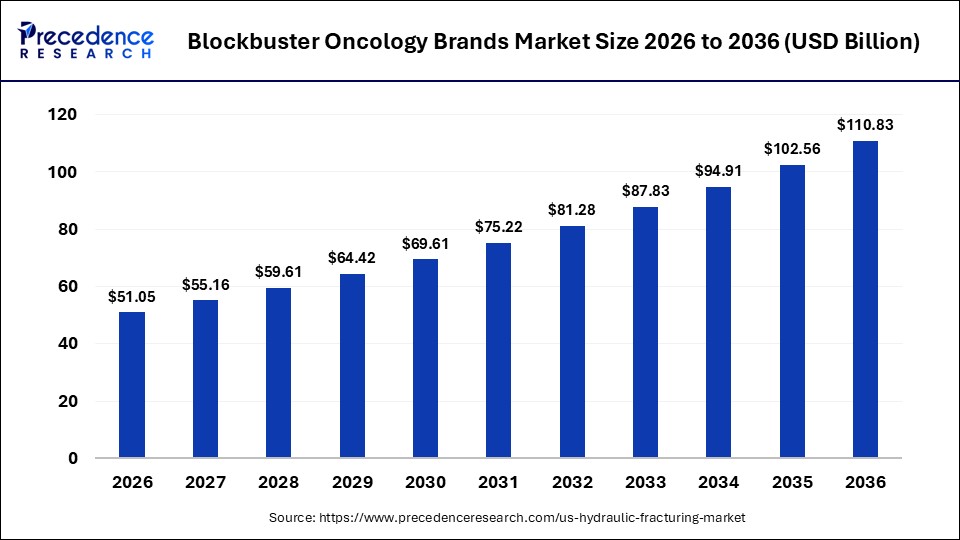
The blockbuster oncology brands market is forecasted to expand from USD 55.16 billion in 2027 to USD 110.83 billion by 2036, growing at a CAGR of 8.06% from 2027 to 2036.
Key Takeaways
Market Size & Growth Outlook
- Market size in 2026: USD 51.05 billion
- Estimated market size in 2027: USD 55.16 billion.
- Projected market size by 2036: USD 110.83 billion.
- CAGR (2027-2036): 8.06%.
Regional Market Spotlight
- North America market share 2026: 43%.
- Europe market share 2026: 27%.
- Asia-Pacific market share 2026: 22%.
Segmental Spotlight
- Immune checkpoint inhibitors segment share 2026: 36%.
- Lung cancer therapeutic area share 2026: 27%.
- Intravenous administration segment share 2026: 49%.
Blockbuster Oncology Brands Market Size 2026 to 2036
The blockbuster oncology brands market is experiencing significant growth due to the rising prevalence of cancer and increasing demand for innovative cancer treatments. Advancements in immunotherapy, targeted therapies, antibody-drug conjugates, and personalized medicine are expected to support industry expansion throughout the forecast period.
How is the Blockbuster Oncology Brands Market Evolving Through 2036?
This broader market provides the demand context for blockbuster oncology brands, but it should not be confused with the narrower revenue pool of individual blockbuster products.
The bottom line is that the whole market can grow very fast despite blockbusters themselves being stagnant or shrinking. Revenue growth will depend on the balance between patient volume expansion, earlier line treatment adoption, indication extensions, pricing, and competitive erosion. Consequently, aggregate market growth should not be applied uniformly to every brand.
A Robust Market Sizing Model Distinguishes:
- Total Oncology Medicine Spending: the broad market benchmark.
- Blockbuster Brand Revenue: annual sales of individual oncology medicines meeting the defined threshold.
- Emerging Blockbuster Revenue: sales of products approaching the threshold.
- At-risk Revenue: sales exposed to exclusivity loss, biosimilar entry or therapeutic substitution.
- Incremental Revenue Opportunity: growth attributable to new indications, new geographies, combination regimens and improved access.
In terms of forecasting, the base case should assume that the existing adoption rate for the treatment and competition entry is achieved. The upside case scenario should account for more rapid expansion of indications, better access and diagnostic, and launch of new modality treatments. A downside case should account for reimbursement restrictions, clinical underperformance, safety signals, pricing interventions and accelerated market share erosion.
Coverage Highlights
- Blockbuster and near-blockbuster brand revenue pools.
- Brand-level growth, market-share changes and incremental revenue.
- Base, upside and downside scenarios.
- Revenue-at-risk analysis by patent status and competitive entry.
Which Product and Therapeutic Segments Generate Maximum Demand Value?
Blockbuster oncology brands are best segmented across therapeutic area, drug modality, mechanism of action, cancer type, treatment setting, and commercial lifecycle stage. Revenue leadership and growth leadership must be assessed separately: mature medicines may retain the largest installed patient base, while newer targeted treatments and ADCs may grow faster from smaller revenue bases.
The main therapeutic segments include lung cancer, breast cancer, hematological malignancies, prostate cancer, gastrointestinal cancers, renal cancer, melanoma and other solid tumors. Modality-based segmentation includes immune checkpoint inhibitors, targeted small molecules, monoclonal antibodies, ADCs, hormonal therapies, radioligand therapies, bispecific antibodies and cell-based treatments.
The modality mix is changing rapidly. Novel modalities, including cell and gene therapy ADCs and multispecific antibodies, accounted for approximately 35% of oncology clinical trials in 2026. This is a pipeline indicator rather than a measure of commercial revenue share, but it highlights the direction of innovation and the potential for future changes in the blockbuster brand hierarchy.
Coverage Highlights
- Therapeutic area and cancer-type revenue segmentation.
- Drug modality and mechanism of action benchmarking.
- Established versus emerging blockbuster brands.
- Revenue contribution from monotherapy and combination treatment.
- Indication-level sales and growth potential.
- Segment-level CAGR and emerging revenue pools.
Blockbuster Oncology Brands Market Segments Analysis
Blockbuster Oncology Brands Market by Therapeutic Area 2026 Share & Size
| Segments | Share | Value (USD Bn) |
| Lung Cancer | 27.00% | 13.782 |
| Breast Cancer | 17.00% | 8.678 |
| Hematological Malignancies | 16.00% | 8.167 |
| Other Major Cancer Areas | 25.00% | 12.762 |
| Other Solid Tumors | 15.00% | 7.657 |
Source: Expert Interview, Secondary Sources, Precedence Research Database, Precedence Research Analysts and Researcher
Lung cancer leads due to strong demand for targeted therapies and immunotherapies
Blockbuster Oncology Brands Market by Drug Modality 2026 Share & Size
| Segments | Share | Value (USD Bn) |
| Immune Checkpoint Inhibitors | 36.00% | 18.377 |
| Targeted Small Molecule Therapies | 24.00% | 12.251 |
| Monoclonal Antibodies and ADCs | 22.00% | 11.23 |
| Hormonal and Endocrine Therapies | 10.00% | 5.105 |
| Other Oncology Drug Modalities | 8.00% | 4.084 |
Source: Expert Interview, Secondary Sources, Precedence Research Database, Precedence Research Analysts and Researcher
Immune checkpoint inhibitors lead through widespread use in immuno-oncology
Blockbuster Oncology Brands Market by Mechanism of Action 2026 Share & Size
| Segments | Share | Value (USD Bn) |
| PD-1/PD-L1 Inhibitors | 31.00% | 15.824 |
| Tyrosine Kinase Inhibitors | 20.00% | 10.209 |
| PARP and CDK4/6 Inhibitors | 15.00% | 7.657 |
| HER2- and EGFR-Targeted Therapies | 15.00% | 7.657 |
| Other Mechanisms | 19.00% | 9.699 |
Source: Expert Interview, Secondary Sources, Precedence Research Database, Precedence Research Analysts and Researcher
PD-1/PD-L1 inhibitors lead due to their broad clinical applications across cancer types
Blockbuster Oncology Brands Market by Cancer Type 2026 Share & Size
| Segments | Share | Value (USD Bn) |
| Non-Small Cell Lung Cancer | 22.00% | 11.23 |
| Breast Cancer | 16.00% | 8.167 |
| Hematological Cancers | 24.00% | 12.251 |
| Gastrointestinal Cancers | 13.00% | 6.636 |
| Other Cancer Types | 25.00% | 12.762 |
Source: Expert Interview, Secondary Sources, Precedence Research Database, Precedence Research Analysts and Researcher
Non-small cell lung cancer leads among individual cancer types due to extensive use of targeted and immune-based treatments
Blockbuster Oncology Brands Market by Treatment Setting 2026 Share & Size
| Segments | Share | Value (USD Bn) |
| First-Line Treatment | 33.00% | 16.845 |
| Second-Line Treatment | 22.00% | 11.23 |
| Third-Line and Later-Line Treatment | 15.00% | 7.657 |
| Adjuvant and Neoadjuvant Treatment | 15.00% | 7.657 |
| Maintenance and Relapsed/Refractory Treatment | 15.00% | 7.657 |
Source: Expert Interview, Secondary Sources, Precedence Research Database, Precedence Research Analysts and Researcher
First-line treatment leads because it serves large eligible patient populations
Blockbuster Oncology Brands Market by Treatment Approach 2026 Share & Size
| Segments | Share | Value (USD Bn) |
| Monotherapy | 38.00% | 19.397 |
| Immunotherapy-Based Combinations | 18.00% | 9.188 |
| Chemotherapy-Based Combinations | 12.00% | 6.126 |
| Targeted Therapy Combinations | 17.00% | 8.678 |
| Other Combination and Multimodal Regimens | 15.00% | 7.657 |
Source: Expert Interview, Secondary Sources, Precedence Research Database, Precedence Research Analysts and Researcher
Monotherapy leads through established branded treatments, while combination regimens support treatment strategies for selected cancers.
Blockbuster Oncology Brands Market by Route of Administration 2026 Share & Size
| Segments | Share | Value (USD Bn) |
| Intravenous | 49.00% | 25.013 |
| Oral | 35.00% | 17.866 |
| Subcutaneous | 12.00% | 6.126 |
| Intramuscular | 1.00% | 0.51 |
| Other Routes | 3.00% | 1.531 |
Source: Expert Interview, Secondary Sources, Precedence Research Database, Precedence Research Analysts and Researcher
Intravenous administration leads because many high-revenue oncology biologics are delivered through clinical infusion.
Blockbuster Oncology Brands Market by Region 2026 Share & Size
| Segments | Share | Value (USD Bn) |
| North America | 43.00% | 21.95 |
| Europe | 27.00% | 13.782 |
| Asia-Pacific | 22.00% | 11.23 |
| Latin America | 4.00% | 2.042 |
| Middle East and Africa | 4.00% | 2.042 |
Source: Expert Interview, Secondary Sources, Precedence Research Database, Precedence Research Analysts and Researcher
North America leads due to high oncology spending and access to innovative branded therapies
What are the Main Drivers and Challenges of the Blockbuster Oncology Brands Market?
The principal demand drivers are rising cancer diagnostic, improved survival in selected malignancies, earlier use of effective therapies, biomarker-guided treatment, and expanded access to innovative medicines. Broader indications would help to greatly expand the patient pool eligible for the existing brand, and combination treatments can help to lengthen the treatment period.
However, expanding the market would put additional pressure on pricing issues. Expensive products might become restricted by payers and could be subject to different treatment sequences or prior authorization. Clinical superiority must therefore translate into measurable benefits, such as survival, response rates, duration of response, or quality of life, to support sustained adoption.
Patent expiry represents the countervailing force. Biosimilars can threaten biologics' franchise, while generics can eat away at the revenues generated from small molecule drugs. Erosion rate is dependent on the number of competitors, regulatory pathway used, contractual issues, switch rates, and availability of other treatment alternatives.
The commercial forecasting models estimate growth and erosion for individual brands separately rather than estimating the growth and erosion using oncology market CAGR.
Coverage Highlights
- Epidemiology, diagnosis and eligible-patient expansion.
- Indication additions and treatment line migration.
- Pricing, reimbursement and affordability constraints.
- Generic and biosimilar competitive threats.
- Clinical differentiation and treatment substitution.
- Revenue sensitivity to patent and regulatory milestones.
What Does the Pricing Analysis of the Blockbuster Oncology Brands Market Indicate?
Oncology brand pricing varies by molecule, treatment duration, dosing schedule, route of administration, treatment setting and geography. The cost of annual treatment cannot be directly compared between the products because some of the products are dosed for a definite period while some others will run as long as there is disease progression or some of the products involve individualized manufacturing process.
List prices are not the same as actual revenue because the actual revenue will depend on rebates, secret discounts, payor deals, assistance programs, distribution deals and government pricing. Therefore, the commercial evaluation will need to separate list price from net price and revenues per treated patient.
Analysis of profitability will have to take into consideration R&D costs, manufacturing, royalties, collaboration economics, commercialization costs and evidence after approval. Biologics and personalized cell therapies may have very different cost structures from oral targeted medicines, even when annual treatment costs appear comparable.
Coverage Highlights
- Annual treatment cost and price-per-cycle comparisons.
- List price versus estimated net realization.
- Revenue per treated patient and treatment duration.
- Regional pricing and reimbursement differences.
- Gross margin and commercialization cost considerations.
- Pricing outlook under biosimilar and payer pressure.
How Do Evidence and Access Affect the Realization of Commercial Potential?
The value chain extends from drug discovery and target validation through clinical development, regulatory approval, manufacturing, market access, distribution, and treatment delivery. Commercial value is concentrated in products that combine meaningful clinical benefit with scalable production, broad reimbursement and sustained physician adoption.
In contrast to traditional commodities markets, aggregate manufacturing capacity alone is insufficient to quantify the supply of oncology medicines. Relevant indicators include product availability, production reliability, biologics manufacturing capacity, treatment-center readiness, cold chain requirements, patient eligibility, and reimbursement coverage. Cell therapies and radiopharmaceuticals add specialized logistics and treatment-site constraints.
Although receiving regulatory approval is an important commercial milestone, it does not guarantee quick market penetration. Companion diagnostics, biomarker testing, real-world evidence, health-technology assessments and local reimbursement decisions can influence the speed of adoption. Additionally, altering treatment recommendations could hasten adoption or lessen the significance of well-known brands.
Coverage Highlights
- Clinical development, approval, and commercialization pathways.
- Biologics, oral medicines and specialized therapy supply chains.
- Manufacturing reliability and treatment delivery infrastructure.
- Regulatory approval and indication expansion milestones.
- Companion diagnostics and biomarker-testing requirements.
- Reimbursement, market access and patient affordability.
What Competitive Strategies Will Decide If Oncology Brands Will Remain Mega Blockbusters or the Future Revenue Drivers?
Revenue concentration is high in the blockbuster oncology brands market due to the presence of mega brands in addition to multi-product brands. In 2026, sales of Keytruda were USD 31.7 billion, while those of Tagrisso and Imfinzi were USD 7.254 billion and USD 6.063 billion, respectively. Sales of Tecentriq were CHF 3.566 billion, while those of Kisqali were USD 4.783 billion. These sales differ in terms of currencies of report, but they demonstrate the level of variance in the commercial sizes of oncology brands. Competitive performance increasingly depends not only on current sales, but also on clinical differentiation, indication expansion, earlier-line adoption and the ability to maintain treatment relevance as standards of care evolve.
The market is developing along three distinct competitive trajectories: scale leadership, accelerated growth and revenue defence. Scale leaders benefit from established prescriber familiarity, broad clinical use and the commercial infrastructure required to support multiple indications. Growth contenders could make progress through clinical differentiation, different treatment environments, and combinations of therapy to strengthen their positioning in changing treatment paradigms. On the other hand, established brands would be faced with the need to maintain revenue through lifecycle management, geographic extension, and combinations in the face of stiffening competition.
The competitiveness of a brand in the future would depend more on its capacity for adoption through clinical differentiation than on its existing revenues. Portfolio leadership and individual brand leadership must be assessed separately. An oncology firm that already has several oncology drugs on its books is better placed than a company that relies solely on its single blockbuster product.
Conversely, a fast-growing specialist brand may present an attractive competitive threat despite having a substantially smaller current sales base. Patent exposure, clinical pipeline depth, partnership economics and the potential for new indications are therefore critical to evaluating the durability of commercial leadership.
The full report examines brand-level sales performance, growth positioning, lifecycle strategies and competitive vulnerabilities while distinguishing individual product revenue from total company revenue and separating product sales from collaboration, alliance and shared-partner revenue.
The competitive intelligence is also structured as a brand-level oncology database, tracking company, product, therapeutic indication, reported annual sales, reporting currency, growth rate where available, geographic presence, development-partner relationships, lifecycle stage, and relevant patent or competitive milestones.
Records can be filtered by company, brand, therapeutic category, geography and year to support like-for-like benchmarking, subject to differences in reporting scope and data availability. By providing more detailed comparisons of commercial scale, growth momentum, and revenue concentration between established leaders and up-and-coming competitors, this dataset enhances the strategic assessment.
Which Manufacturers Control the Most Important Blockbuster Oncology Franchises?
The following is a Tentative Leading Company Universe, selected for relevance to blockbuster oncology medicines rather than total pharmaceutical size. The list is not a definitive ranking of oncology-brand revenue.
| Company | Headquarters | Market Position and Core Strength |
| Merck & Co. | United States | Large-scale immuno-oncology; Keytruda |
| AstraZeneca | United Kingdom | Targeted therapies and immuno-oncology |
| Roche | Switzerland | Antibodies, breast cancer and immunotherapy |
| Bristol Myers Squibb | United States | Immuno-oncology and hematological cancers |
| Johnson & Johnson | United States | Hematological oncology and targeted therapies |
| Novartis | Switzerland | Targeted therapies, radioligands and cell therapy |
| Pfizer | United States | Breast cancer and targeted oncology |
| Eli Lilly and Company | United States | Targeted oncology and breast cancer |
| AbbVie | United States | Hematological oncology |
| Astellas Pharma | Japan | Prostate and other solid-tumor therapies |
| Daiichi Sankyo | Japan | Antibody-drug conjugates |
| Gilead Sciences | United States | Cell therapy and breast cancer |
| Amgen | United States | Hematological oncology and targeted biologics |
| Takeda Pharmaceutical | Japan | Hematological oncology |
| Regeneron Pharmaceuticals | United States | Antibody-based cancer treatments |
| GSK | United Kingdom | Hematological and ovarian cancer treatments |
| Bayer | Germany | Prostate cancer and radiopharmaceuticals |
| Sanofi | France | Hematological oncology and established biologics |
| Eisai | Japan | Oncology and targeted treatments |
| BeiGene (BeOne Medicines) | China | Hematological and solid-tumor oncology |
| Innovent Biologics | China | Immuno-oncology and biologics |
| Jiangsu Hengrui Pharmaceuticals | China | Oncology drug development and commercialization |
| Exelixis | United States | Targeted therapies in solid tumors |
| Incyte | United States | Targeted and hematological oncology |
| Servier | France | Specialist oncology and hematological malignancies |
Why is Brand-Level Revenue More Informative than Company-Wide Sales?
Keytruda's USD 31.7 billion in 2025 sales establishes a clear benchmark for blockbuster oncology scale. Nevertheless, the market share of this product in terms of the blockbuster brand definition cannot be determined precisely due to the absence of a constant denominator that would include all relevant products.
A defensible ranking should therefore report brand revenue, year-on-year growth, indication exposure, geographic mix, ownership economics, and exclusivity timing. It should also distinguish a brand's global revenue from the revenue recognized by each partner.
The full analysis quantifies the top five and top ten brands, the remaining revenue pool, estimated concentration ratios and annual share gains or losses. If the sales figures are revealed solely at the franchisee level, then the ranking should be done using ranges of sales figures.
What Does the Competitive Benchmarking Indicate?
Brand-level benchmarking compares annual sales, growth, number of approved indications, geographic penetration, treatment-line positioning, clinical evidence, pipeline depth and exposure to competing mechanisms.
The difference between existing and growing franchise is quite telling. The sales of Tagrisso in 2025 grew to USD 7.254 billion, up by about 10% on an annual basis, while those of Imfinzi grew to USD 6.063 billion, up by about 29%. This is an example of how drugs in the same cancer portfolio can grow at quite different rates.
It will be useful to find out whether the growth is achieved due to increased numbers of patients, new indications, longer periods of usage, geographical expansion or increased pricing. It should also evaluate the sustainability of that growth against clinical competition and future exclusivity events.
How Does Portfolio Breadth Influence Competitive Strength and Growth Potential in Oncology?
A diverse oncology portfolio can help mitigate development risks across cancer types, pathways, and stages of a product's life cycle. In contrast, a specialized company might focus its efforts on a few selected indications.
The most important portfolio dimensions are:
- Breadth across solid tumors and hematological malignancies.
- Exposure to immunotherapy, targeted medicines, ADCs and radioligand therapies.
- Number and maturity of commercial products.
- Dependence on individual blockbuster brands.
- Pipeline adjacency to existing commercial franchises.
- Revenue diversification across treatment settings and geographies.
A portfolio breadth on its own cannot define a leader. This review looks at whether the company can move from research to approval, reimbursement, physician acceptance, and sustained net income.
How Does the ADCs, Radioligands and Multispecific Antibodies Expand the Competitive Frontier?
Oncology research is moving beyond conventional chemotherapy and single-mechanism targeted treatments. ADCs seek to deliver cytotoxic payloads more selectively, radioligand therapies combine tumor targeting molecules with radioactive isotopes, and multispecific antibodies engage more than one biological target or cell population.
The pipeline signal is significant: novel modalities represented approximately 35% of oncology trial activity in 2026, while 25 new oncology active substances were launched globally that year. The figures indicate a substantial flow of innovation, although not every trial or launch will produce a commercially successful blockbuster.
The report assesses innovation through pipeline maturity, number of trials, regulatory achievements, approval indications, development and commercialization partnerships. The report also analyzes if the new modality will replace the current one or be an add-on to the current brand(s).
How Does Market Leadership Depends on Cancer Type and Access?
Competitive strength varies across tumor types. A manufacturer may lead in lung cancer but hold a weaker position in breast cancer or hematological malignancies. In this context, global rankings may conceal relevant variations in indication-level competition.
Performance is not identical geographically because of reimbursement, diagnostics, guidelines, pricing, and regulatory approvals. Wealthier markets tend to have better access to novel medicines, while developing countries can become sources of additional patients as diagnosis and affordability levels grow.
The competitive assessment includes brands' ranking by each major type of cancer and by geographic region. It evaluates direct competitors, substitute treatments, local-market challengers and the commercial impact of different launch sequences.
What Makes Reliable Supply and Market Access So Important for Brands?
Manufacturing benchmarks vary by product modality. Oral targeted therapies depend on reliable pharmaceutical production and distribution; biologics require specialized manufacturing and quality controls; cell therapies and radiopharmaceuticals can require more complex logistics and treatment infrastructure.
Key customer groups include oncology hospitals, cancer centers, specialist physicians, pharmacy networks, distributors, payers and government procurement bodies. Purchases are made based on clinical guidelines, reimbursement, treatment guidelines, safety, availability, and total cost of treatment.
The report compares manufacturing footprint, product availability, distribution reach, treatment center access, payer relationships and regional commercialization capabilities. They are especially significant when evaluating whether a brand that is otherwise very good can be scaled up.
How are Partnerships and Acquisitions Reshaping Oncology's Future Revenue Pools?
Business development is a central mechanism for securing new oncology growth. Licensing, co-development, acquisitions, and partnering for commercialization allow drug companies to gain differentiated assets, new modalities, and complementary geographic strengths.
This report differentiates between acquisitions of revenue-producing franchises versus pipeline deals. It examines deal size, milestone terms when disclosed, development status, therapeutic compatibility, commercial synergies, and possible overlap with current products.
The critical issue is whether transactions generate a realistic path to sustained revenue growth or just additional development costs. Portfolio fit, clinical differentiation and the ability to commercialize acquired products are central to the assessment.
What are the Opportunities and White Spaces of the Blockbuster Oncology Brands Market?
Treatments that address large or underserved patient populations and show significant clinical distinction are likely to have the most alluring chances. Priority areas include ADCs, radioligand therapies, bispecific antibodies, biomarker-defined cancers, and therapies that can move into earlier treatment settings.
Nevertheless, novelty in science does not always guarantee a blockbuster drug in the market. This would depend on how many patients could be reached, the length of time for treatment, the possible price point, competition, manufacturing capability, and payability.
The complete study analyzes white spaces by tumor type, line of treatment, geographies, and technology platforms, looking for unmet needs that have commercial potential.
What are the Potential Entry Barriers of the Blockbuster Oncology Brands Market?
| Competitive Force | Assessment | Strategic Interpretation |
| Supplier power | Medium | Specialized biologics inputs and radiopharmaceutical infrastructure can create dependencies. |
| Buyer power | High | Payers and healthcare systems influence reimbursement, net pricing, and treatment access. |
| Threat of new entrants | Low-Medium | Clinical, regulatory, capital, and commercialization barriers are substantial. |
| Threat of substitutes | High | Competing mechanisms, new treatment combinations and biosimilars can displace established brands. |
| Competitive rivalry | High | Manufacturers compete on efficacy, safety, indications, access and lifecycle management. |
What are the Market Attractiveness Parameters of Blockbuster Oncology Brands?
Political and legal issues include drug pricing policies, intellectual property rights, regulatory approvals, and reimbursement policies. Economic issues include healthcare budgets, treatment affordability, research spending, and manufacturing costs. Social issues include cancer incidence rates, patient accessibility, and diagnosed disparities. Technological factors include precision medicine, ADCs, cell therapies, and advanced diagnostics. Environmental considerations are primarily associated with pharmaceutical manufacturing, clinical supply chains, and waste management rather than being the principal determinants of brand sales.
Market attractiveness is greatest when a therapy is used to treat an important unmet need, shows differential clinical value, has an adequate patient population, and has a plausible reimbursement pathway. Established products with well-defined clinical positioning can continue to have commercial attractiveness, but their value should factor in risks of competition and lack of exclusivity.
Which Parameters Will Define the Next Phase of Growth in the Blockbuster Oncology Brands Market?
There are three potential scenarios for the future:
- Base Case: Continued use of differentiated medicines with indication and geographical expansion, countered somewhat by patent expiration and pricing pressures.
- Upside Case: stronger uptake of novel modalities, successful movement into earlier treatment lines and faster expansion of eligible patient populations.
Downside Case: slower reimbursement, clinical setbacks, intensified competition and faster-than-expected erosion of mature franchises.
By 2035, delivering significant clinical results, proving value to payers, expanding indications, and replenishing revenue as current drugs mature will all be crucial components of competitive positioning. ADCs, radioligand therapies, multispecific antibodies and precision oncology represent important areas to monitor, but their ultimate commercial contribution will depend on clinical success and real-world adoption.
Therefore, managing the entire brand life cycle, identifying high-potential indicators, developing solid proof, maximizing access, safeguarding differentiation, and establishing successor products before revenue erosion accelerates, is a strategic priority for manufacturers.
Key Strategic Questions
- What is the global revenue pool for blockbuster oncology brands, and how does it compare with total oncology medicine spending?
- How much revenue is attributable to Which brands gencurrent erate the hexpanding brands successful in the market?immunotherapiesighest annual revenue, and how concentrated is the market among the leading products?
- Which therapeutic areas and cancer types account for the largest blockbuster revenue pools?
- What makes the most rapidly , targeted therapies, ADCs, and other emerging modalities?
- Which major branded products are most vulnerable to patent expiration, generic competition, or biosimilar threats?
- How do list prices, net realizable values, course of therapy, and reimbursement impact branded product economics?
- Which companies possess the optimal mix of business size, pipeline strength, and product lifecycle management skills?
- How can clinical data and indication extension enhance competitive position?
- Which geographic markets offer the greatest incremental patient-volume opportunities?
- How are alliances, licenses, and mergers redefining future oncology franchises?
- Which emerging modalities have the strongest potential to establish new blockbuster brands?
- Where do unmet clinical needs and commercial opportunities overlap most clearly?
- Which manufacturers are best positioned to replace revenue from mature or patent-exposed brands?
- What are the key strategic priorities for oncology brand leadership until 2035?
Blockbuster Oncology Brands Market Segments
By Therapeutic Area
- Lung Cancer
- Breast Cancer
- Hematological Malignancies
- Prostate Cancer
- Colorectal and Other Gastrointestinal Cancers
- Renal Cell Carcinoma
- Melanoma and Other Skin Cancers
- Gynecological Cancers
- Liver Cancer
- Other Solid Tumors
By Drug Modality
- Immune Checkpoint Inhibitors
- Targeted Small Molecule Therapies
- Monoclonal Antibodies
- Antibody-Drug Conjugates (ADCs)
- Hormonal and Endocrine Therapies
- Bispecific and Multispecific Antibodies
- Radioligand and Radioisotope-Based Therapies
- Cell-Based Therapies, Including CAR-T
- Other Oncology Drug Modalities
By Mechanism of Action
- PD-1/PD-L1 Inhibitors
- CTLA-4 Inhibitors
- Tyrosine Kinase Inhibitors (TKIs)
- PARP Inhibitors
- CDK4/6 Inhibitors
- HER2-Targeted Therapies
- EGFR-Targeted Therapies
- BCR-ABL and Other Kinase Inhibitors
- Hormone Receptor Modulators
- Other Targeted and Immunomodulatory Mechanisms
By Cancer Type
- Non-Small Cell Lung Cancer (NSCLC)
- Small Cell Lung Cancer (SCLC)
- Breast Cancer
- Prostate Cancer
- Colorectal Cancer
- Gastric and Esophageal Cancers
- Leukemia
- Lymphoma
- Multiple Myeloma
- Renal Cell Carcinoma
- Melanoma
- Ovarian and Other Gynecological Cancers
- Other Cancer Types
By Treatment Setting
- First-Line Treatment
- Second-Line Treatment
- Third-Line and Later-Line Treatment
- Adjuvant Treatment
- Neoadjuvant Treatment
- Maintenance Treatment
- Relapsed or Refractory Disease Treatment
By Treatment Approach
- Monotherapy
- Combination Therapy
- Chemotherapy-Based Combinations
- Immunotherapy-Based Combinations
- Targeted Therapy Combinations
- Multimodal Treatment Regimens
By Route of Administration
- Oral
- Intravenous
- Subcutaneous
- Intramuscular
- Other Routes of Administration
By Region
- North America
- Europe
- Asia-Pacific
- Latin America
- Middle East and Africa
For inquiries regarding discounts, bulk purchases, or customization requests, please contact us at sales@precedenceresearch.com
Frequently Asked Questions





Ask For Sample
No cookie-cutter, only authentic analysis – take the 1st step to become a Precedence Research client
 Get a Sample




 sales@precedenceresearch.com
 Schedule a Meeting