Mechanical Recycling of Plastics Market Trends, Leading Companies, Company Revenue / Sales Performance, Plant Utilization, Production Volume, Pricing Dynamics, Supply Chain Performance, Competitive Landscape, and Industry Growth
The mechanical recycling of plastics market is driven by rising need for recycled resins, increasing plastic waste recovery, and growing acceptance of circular economy practices across packaging, construction, automotive, and consumer goods industries. Key trends include advancements in sorting and processing technologies, recycled-content initiatives, stricter plastic waste management regulations, and greater emphasis on material recovery efficiency. Growing sustainability commitments, need for cost-effective recycled materials, and investment in recycling infrastructure are anticipated to create new opportunities through 2035.
Source: https://www.precedenceresearch.com/mechanical-recycling-of-plastics-market
 Get a Sample
 Table Of Content


Mechanical Recycling of Plastics Market Size, Share, Trends and Growth Forecast 2035
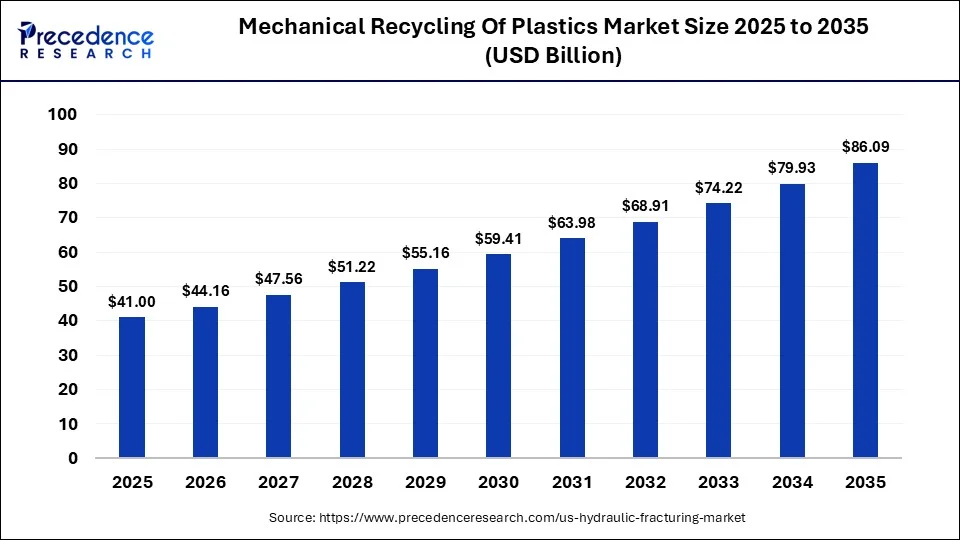
The mechanical recycling of plastics market is forecasted to expand from USD 44.16 billion in 2026 to USD 86.09 billion by 2035, growing at a CAGR of 7.7% from 2026 to 2035.
Key Takeaways
- Growing demand for recycled plastics is driven by circular economy initiatives, waste reduction efforts, and recycled-content requirements.
- Packaging accounted for approximately 35% of market revenue in the 2026 benchmark.
- Polyethylene (PE) represented nearly 33% of market revenue in 2026, making it the largest reported polymer segment.
- Europe held roughly 35% of market revenue in 2026, supported by established recycling infrastructure and regulations.
- Feedstock quality and availability directly influence recycling efficiency, resin quality, and profitability.
- Advanced sorting, washing, filtration, and extrusion technologies can improve recovery yields and recycled-resin quality.
- Competition from cheaper virgin plastics can affect recycled-resin demand and recycler profit margins.
- PET, PE, PP, and engineering plastics offer varied recycling opportunities depending on material quality and processing requirements.
- Installed recycling capacity does not guarantee high output, as utilization, contamination, and processing yields affect production.
- Recyclers with reliable feedstock, efficient operations, consistent resin quality, and strong customer relationships are better positioned for sustainable growth.
How do Recycled Resin Quality, Feedstock Availability, and Regulatory Demand Define Market Growth?
Mechanical recycling uses physical processes, including shredding, washing, sorting, separation, extrusion, and then pelletizing, to convert plastic waste into reusable flakes, granules, or pellets without breaking the polymer down into its constituent chemical building blocks. Its commercial advantage lies in established processing infrastructure along with the ability to produce recycled material for packaging, automotive components, construction, consumer products, and industrial applications.
Polyethylene (PE) represented nearly 33% of market revenue in 2026, while packaging accounted for roughly 35%. Europe held roughly 35% of revenue in the same year, thus reflecting its established collection along with recycling infrastructure and regulatory impact on circular material use. These historical benchmarks indicate where existing need is concentrated, although current shares may differ.
The market's central commercial challenge is converting collected waste into recycled resin that meets customer requirements for odour, contamination, colour, mechanical performance, consistency, and even regulatory compliance. PET bottle recycling and selected PE and polypropylene (PP) streams benefit from established collection along with processing systems. Mixed plastics, contaminated films, multilayer packaging, and certain engineering polymers generally need more intensive sorting and processing.
The competitive structure spans waste collection firms, specialist recyclers, recycled-resin producers, integrated packaging groups, and polymer manufacturers developing circular-material businesses. The strongest commercial positions thus tend to combine reliable feedstock access, efficient processing, high product yields, and even contracted demand. Installed capacity alone does not guarantee attractive returns when virgin resin prices fall, or users resist the premium associated with recycled material.
Key Coverage
- Polymer-level analysis covering PE, PP, PS, PET, PVC, ABS, and a few engineering plastics.
- Revenue, throughput, recovery yield, processing capacity, utilization, and recycled-resin pricing.
- Regional need and supply comparisons across Europe, North America, Asia Pacific, Latin America, and the Middle East and Africa.
- Regulatory effects on recycled-content demand, product design, collection systems, and investment.
- Competitive positioning of integrated recyclers, specialist processors, along with recycled-polymer suppliers.
How Demand for Recycled Resin Expands Faster Where Collection and Offtake are Established?
The market's growth reflects the growing use of recycled polymers in packaging, construction materials, consumer goods, and industrial manufacturing. This offers a useful reference scenario rather than a universal forecast, because market estimates differ in their treatment of recycled resin, processing revenue, along with equipment-related activities.
A consistent forecast must distinguish market revenue from the physical volume of plastic waste processed. Revenue can rise as a result of greater throughput, improved recovery yields, higher-value recycled grades, more extensive processing, or increases in selling prices. Conversely, volumes can expand while revenue growth remains subdued when virgin resin prices decline, or recycled-material discounts widen.
The full analysis separates three growth scenarios. The base case assumes continued regulatory implementation, gradual expansion of recycled-resin purchasing, and incremental investment in collection and sorting. The upside case incorporates stronger recycled-content requirements, enhanced collection rates, higher-quality output, along with more long-term offtake agreements. The downside case considers weak virgin-resin prices, inconsistent feedstock quality, delayed infrastructure investment, and lower-than-expected customer adoption.
Regional forecasts distinguish collection maturity from manufacturing growth. Europe benefits from established recycling infrastructure as well as policy-driven demand. North America provides opportunities to enhance post-consumer collection, sorting, and film recycling. Asia Pacific combines large plastic-processing industries with substantial variation in waste-management infrastructure and even the quality of collected feedstock.
Key Coverage
- Revenue expansion separated from tonnes processed and recycled-resin production.
- Regional and country-level forecasts, which include volume and value contributions.
- Base, upside, and downside scenarios with explicit need and pricing assumptions.
- Sensitivity analysis for virgin-resin prices, recovery yields, collection rates, and regulatory implementation.
Segmentation Analysis - Why Polyolefins Offer Scale, While High-Quality PET and Specialty Grades Support Differentiation?
PE held nearly 33% of market revenue in the 2026 benchmark, making it the largest reported polymer segment. Packaging accounted for approximately 35% of application revenue. These shares establish the significance of flexible and rigid packaging streams but should not be interpreted as current-year measurements without updated data.
The market requires segmentation across several dimensions:
| Segmentation dimension | Principal categories | Commercial significance |
| Polymer | PE, PET, PP, PS, PVC, ABS, other engineering plastics | Determines sorting complexity, processing conditions, and end-use suitability |
| Waste source | Post-consumer, post-industrial | Influences contamination, traceability, and yield |
| Feedstock form | Bottles, rigid containers, films, trays, industrial scrap | Determines collection economics and preparation requirements |
| Output form | Flakes, regrind, pellets, compounds | Determines downstream processing and achievable selling price |
| Application | Packaging, building and construction, automotive, consumer goods, electrical and electronics, other industrial uses | Determines specifications and qualification requirements |
| Process | Sorting, washing, size reduction, separation, extrusion, filtration, pelletizing | Determines processing costs and recovery efficiency |
| Quality grade | General-purpose, colour-sorted, high-purity, food-contact-approved where permitted | Determines customer eligibility and potential price premium |
PET benefits from relatively mature bottle collection and even bottle-to-bottle recycling systems in markets with established deposit-return or collection infrastructure. PE and PP provide broad application potential, but mixed colours, multilayer structures, film contamination, and inconsistent feedstock can limit the production of higher-value grades.
Engineering plastics can command differentiated value when recovered with reliable polymer identification and property retention, although their heterogeneous waste streams can make economics more difficult.
Post-industrial scrap generally provides cleaner and more predictable feedstock than mixed post-consumer waste. However, its supply is constrained by manufacturing scrap availability, while post-consumer recycling provides a larger circularity opportunity but demands more extensive collection, sorting, and decontamination.
The full report quantifies each segment by revenue, processing volume, growth rate, regional contribution, output quality, and end-use suitability. It also distinguishes the largest revenue pool from the fastest-growing opportunity rather than assuming that the two are the same.
Key Coverage
- Polymer-level market shares and growth forecasts.
- Rigid packaging versus flexible film recycling.
- Post-consumer versus post-industrial feedstock economics.
- Flakes, pellets, compounds, and higher-purity output grades.
- Application-level demand, quality requirements, and premium potential.
- Emerging opportunities in recycled engineering plastics and difficult-to-process waste streams.
Market Dynamics - Feedstock Quality and Recycled-Content Demand Determine Commercial Viability
echanical recycling benefits from pressure to limit plastic waste, corporate packaging commitments, extended producer responsibility (EPR), along with regulations that encourage recycled material use. Yet the sector does not grow simply as more waste is generated. Profitable expansion depends on the quantity of material collected, the proportion suitable for processing, saleable output yield, along with customer willingness to purchase recycled resin.
What Drives the Market?
Packaging remains a principal demand pool because containers, bottles, films, and transport packaging create recurring waste streams. Recycled-content requirements and procurement commitments can enhance demand visibility, particularly when supported by multiyear supply contracts. Manufacturers also have incentives to diversify material sourcing and decrease exposure to virgin-resin price volatility.
What Restrains the Market?
Contamination, pigments, adhesives, mixed polymers, additives, and multilayer structures can reduce recovery yields and raise sorting, washing, and filtration costs. Food-contact applications face additional quality requirements along with regulatory requirements. Mechanical processing also cannot indefinitely preserve polymer properties: repeated heat and shear exposure may decrease molecular weight or alter performance, depending on the material and process.
Commercial Risks
When virgin resin prices decline, recycled resin may become less competitive unless regulation, product specifications, or contractual commitments support need. Conversely, a shortage of high-quality post-consumer feedstock can raise input prices even when lower-grade waste remains abundant.
Strategic Opportunities
Investments in optical sorting, odour removal, melt filtration, automated quality control, and feedstock traceability can enhance the proportion of output sold into demanding applications. The analysis evaluates these factors via sensitivity testing of feedstock cost, energy consumption, saleable yield, processing cost, and recycled-resin selling price.
Key Coverage
- Growth drivers and restraints quantified by polymer and application.
- Virgin-versus-recycled resin substitution economics.
- Regulatory demand versus voluntary purchasing commitments.
- Feedstock quality, contamination, and recovery-yield sensitivity.
- Profitability implications of feedstock shortages and falling virgin-resin prices.
- Investment opportunities in sorting, decontamination, filtration, and quality assurance.
Mechanical Recycling of Plastics Market Key Companies
| Company | Headquarters | Market position | Core strength and relevant exposure |
| Veolia | France | Integrated operator | Collection, sorting, and plastics recycling |
| SUEZ | France | Integrated operator | Waste recovery and recycling infrastructure |
| REMONDIS | Germany | Regional/global operator | Collection, recovery, and material processing |
| PreZero | Germany | Integrated operator | Waste sorting and circular materials |
| Renewi | United Kingdom | Regional specialist | Waste recovery and recycled material production |
| Indorama Ventures | Thailand | PET recycling leader | Bottle collection, PET flakes, and recycled resin |
| Plastipak | United States | Packaging-integrated recycler | PET recycling and packaging integration |
| KW Plastics | United States | Polymer specialist | Recycled HDPE and PP |
| MBA Polymers | United States | Specialty recycler | Recovered engineering plastics |
| Borealis | Austria | Integrated polymer participant | Circular polyolefins and recycled materials |
| LyondellBasell | United States | Polymer-integrated participant | Mechanical recycling assets and circular polymers |
| Ravago | Luxembourg | Materials-integrated operator | Recycled polymers, compounding, and distribution |
| ALPLA | Austria | Packaging-integrated recycler | PET recycling and recycled packaging materials |
| Veolia Polymers | France | Operating business category | Polymer recovery within an integrated waste network |
| Envision Plastics | United States | Resin specialist | Post-consumer HDPE and recycled resin |
| Revolution Sustainable Solutions | United States | Film specialist | Recycled film resins and packaging integration |
| Circulus | United States | Polyolefin specialist | Recycled PE and PP materials |
| Merlin Plastics | Canada | Regional recycler | Post-consumer plastics processing |
| ReVital Polymers | Canada | Regional recycler | Recovered rigid plastics and recycled resin |
| Plastrec | Canada | Polymer specialist | Recycled plastic resins |
| GreenDot | Germany | European recycler | Post-consumer plastics and circular materials |
| Faerch | Denmark | Packaging-integrated recycler | PET tray-to-tray recycling |
| Biffa | United Kingdom | Regional operator | Collection, sorting, and plastics processing |
| Republic Services | United States | Integrated waste operator | Collection and polymer recovery infrastructure |
| Berry Global | United States | Downstream integration | Recycled-content packaging and polymer procurement |
Which Competitive Capabilities Will Determine Leadership in the Mechanical Recycling of Plastics Market?
The mechanical recycling of plastics market is characterized by a diverse competitive base spanning integrated waste management operators, packaging manufacturers, specialist polymer recyclers, and resin producers. Competition varies considerably by polymer type, feedstock quality, processing scale, and even the ability to deliver recycled materials that meet customer specifications. PET recycling benefits from established bottle collection and bottle-to-bottle processing systems, while recycled HDPE and PP suppliers compete on sorting efficiency, contamination control, resin consistency, and access to reliable post-consumer feedstock. Engineering plastics represent a more specialized segment in which material separation and recovery expertise can influence product value. However, comparable company-level revenue, recycling volumes, along with market-share data are not consistently available across these different business models, thus making a single global market ranking potentially misleading.
Our analysis indicates that competitive advantage depends less on recycling capacity alone and more on the ability to connect feedstock procurement, recycled-resin quality, processing efficiency, and downstream customer demand. Integrated operators can benefit from control over collection and sorting networks, whereas specialist recyclers may differentiate themselves via polymer expertise, higher-purity output, or application-specific grades. Packaging-integrated businesses can also gain from more direct access to recycled-material need and established customer relationships. In our assessment, the most meaningful competitive comparisons therefore need to distinguish between installed capacity and saleable output, as well as between general-purpose recycled resin and even material suitable for demanding applications.
In our view, the strongest strategic positions are likely to emerge where reliable feedstock access is matched with consistent product quality and commercially secure offtake. Recyclers with underutilized facilities, variable input quality, or limited access to premium applications may face pressure on operating economics even when nominal capacity is substantial. Conversely, firms that improve sorting yields, reduce processing losses, develop traceable recycled grades, along with establish long-term supply agreements may be better positioned to withstand fluctuations in virgin-polymer prices and recycled-resin demand. The strategic implication is that capacity growth should be assessed alongside utilization, product mix, customer qualification requirements, yield, and regional feedstock availability.
How Will Market Growth and Polymer-Level Demand Shape the Mechanical Recycling of Plastics Market Through 2035?
polyethylene (PE), polypropylene (PP), and polyethylene terephthalate (PET) represent important material categories, while packaging remains a major application due to its substantial plastics consumption and need for recycled-content materials. Regional demand also differs according to collection infrastructure, regulatory requirements, recycling capacity, and the availability of suitable feedstock.
Our analysis indicates that market expansion will depend not only on the volume of plastic collected for recycling but also on how efficiently that material can be converted into commercially usable resin. PET benefits from established bottle-recycling pathways, while PE and PP provide opportunities across films, containers, rigid packaging, and industrial products. However, differences in contamination, color, degradation, polymer mixing, and end-use specifications affect recovery yields and the price recyclers can command.
Segmentation by polymer type, recycled product form, feedstock source, and end-use application is essential to distinguish high-volume markets from applications where quality requirements may support stronger commercial positioning. Moreover, headline market growth should therefore be interpreted alongside the composition and value of recycled output.
The most significant strategic implication is that growth opportunities will not be distributed evenly across all polymers, applications, or regions. Investors and market participants demand to assess where feedstock availability, processing economics, customer demand, along with recycled-content requirements align. Expansion into a high-demand segment may provide limited returns if feedstock quality is inconsistent or processing losses are high; conversely, specialized recycling capabilities and even established customer relationships may support differentiation in applications requiring consistent resin performance.
Recycling Capacity Keeping Pace with Feedstock Availability and Demand for Recycled Plastics?
Mechanical plastics recycling capacity depends on three linked variables: the volume and quality of recoverable plastic waste, the efficiency of sorting along with processing operations, and the need for recycled resin across end-use industries. Announced plant capacities alone do not establish the volume of material entering the market, as actual output is influenced by feedstock availability, contamination, process losses, operating utilization, and product specifications. For example, a facility with 50,000 tonnes per year of input capacity operating at 85% utilization and achieving a 77% saleable yield would produce approximately 30,000 tonnes of marketable recycled material annually. This illustrates why nominal capacity can materially overstate effective supply when operating performance is not considered.
Our analysis indicates that the key supply-side measure is saleable recycled output rather than installed capacity. Regional differences in collection infrastructure, access to suitable post-consumer and post-industrial feedstock, sorting quality, and the availability of processing technology can create uneven capacity utilization. At the same time, the need for recycled resin is not uniform across polymer categories: buyers may demand specific melt-flow properties, purity, consistency, color, or traceability. Our assessment is that capacity additions will create the greatest commercial value when they address a clearly identified feedstock stream and produce grades that meet established customer requirements. Facilities that expand faster than their access to reliable inputs or qualified buyers may face weaker utilization and pressure on unit economics.
In our view, capacity benchmarking should distinguish operational assets from announced projects and compare input capacity, processing yield, utilization, and saleable output wherever reliable data are available. This approach assists in identifying potential regional supply gaps, feedstock bottlenecks, underutilized infrastructure, and the risk of competing capacity additions exceeding demand for particular recycled grades. For investors and recyclers, the implication is that new capacity should be evaluated against local waste availability, customer qualification requirements, logistics costs, and expected resin demand, not simply against headline market growth.
How Do Recycled Resin Price Spreads, Feedstock Quality and Processing Yields Shape Profitability in Mechanical Plastics Recycling?
Mechanical plastics recycling profitability depends on the relationship between feedstock acquisition costs, saleable output, processing expenses, and realized recycled-resin prices. Pricing varies by polymer, color, contamination level, grade, and processing stage, with PET flakes and pellets, recycled polypropylene, natural HDPE, and mixed-polyolefin grades operating under different commercial conditions. Recyclers must also account for yield losses during sorting, washing, filtration, along with extrusion, as incoming waste volumes do not translate directly into saleable resin. The price spread between recycled and virgin polymers is particularly important as it influences customer purchasing decisions and the ability of recyclers to recover operating and capital costs.
Our analysis indicates that feedstock quality and processing efficiency can be as essential to profitability as the selling price of recycled resin. A facility that secures relatively clean, consistent feedstock and achieves higher recovery yields can generate more saleable material from each tonne processed, while contaminated or mixed plastics increase sorting requirements, residue disposal, and the risk of rejected output. In our assessment, recyclers with dependable feedstock contracts, efficient processing lines, along with established customer relationships are better positioned to handle fluctuations in virgin-resin prices and protect margins. Premium-grade recycled polymers may provide stronger revenue per tonne, but these opportunities must be evaluated against the additional investment along with quality-control requirements required to meet customer specifications.
The most significant commercial implication is that recycling profitability should be assessed on a contribution-per-tonne basis rather than through headline resin prices alone. A meaningful assessment considers feedstock cost, energy consumption, processing yield, labor, logistics, residue disposal, water treatment, and plant utilization alongside the realized selling price. Changes in virgin-polymer prices can narrow the recycled-resin price advantage or weaken the willingness of converters to pay a premium, while recycled-content requirements and then long-term offtake agreements can support the need for qualified material.
How are Regulatory Requirements, Sustainability Priorities and Recycling Technologies Shaping the Commercial Outlook for Mechanical Plastics Recycling?
Mechanical plastics recycling functions at the intersection of waste-management regulation, recycled-content need, and the technical limits of material recovery. Regulatory requirements associated with plastic waste collection, recycling, packaging design, and even recycled-material use can influence the availability of feedstock and the need for recycled resin. At the same time, sustainability commitments from brand owners and packaging producers are increasing the significance of traceable recycled content, consistent material quality, and reliable supply. However, the commercial value of these drivers varies by polymer type, contamination level, end-use requirements, and even the ability of recyclers to produce material that meets customer specifications.
Our analysis indicates that regulation and sustainability commitments can strengthen the need for recycled plastics, but they do not automatically translate into profitable recycling operations. Moreover, mechanical recycling remains sensitive to sorting efficiency, washing performance, processing yields, material degradation, and the quality of incoming waste. Improvements in optical identification, filtration, automated sorting, and extrusion can help recyclers enhance output consistency and reduce material losses. Our assessment is that facilities combining dependable feedstock access with effective process control are better positioned to serve customers demanding repeatable recycled-resin specifications. Technology investment is therefore most commercially relevant when it enhances usable output, decreases operating costs, or enables access to higher-value applications.
The key strategic implication is that recyclers and investors should evaluate regulatory exposure, sustainability-led demand, along with technology capabilities together rather than treating them as separate growth drivers. Changes in compliance requirements may create demand opportunities, while stricter quality expectations can raise the cost of qualifying recycled materials for demanding applications. The strongest investment cases are likely to depend on the alignment of local waste availability, regulatory conditions, processing economics, and also customer offtake commitments. Companies should assess technology upgrades against measurable improvements in resin quality, recovery rates, energy and water consumption, and cost per tonne rather than relying on sustainability positioning alone.
Key Strategic Questions
- Which polymers generate the largest revenue pools, and which offer the strongest growth potential?
- How do contamination, recovery yields, and utilization affect recycler profitability?
- Which regions offer the strongest combination of feedstock supply and customer demand?
- How do post-consumer and post-industrial feedstock economics differ?
- What determines recycled-resin prices relative to virgin polymers?
- How do leading recyclers compare on capacity, output quality, product breadth, and geographic reach?
- Which companies are expanding mechanical recycling capacity, and how much of that capacity is operational?
- How will packaging regulation and EPR influence investment and recycled-content purchasing?
- Which recycling business models offer the strongest feedstock and customer advantages?
- Where can technology improvements make difficult plastic waste streams commercially recyclable?
- What are the principal risks to plant utilization, price realization, and investment returns?
- What role will acquisition, partnerships, and vertical integration play in consolidation?
- Which applications offer the greatest opportunity for higher-value recycled polymers?
- Which technologies, regions, and business models are best positioned to capture future growth?
Mechanical Recycling of Plastics Market Segments
By Plastic Type
- Polyethylene (PE)
- olyethylene Terephthalate (PET)
- Polypropylene (PP)
- Polystyrene (PS)
- Polyvinyl Chloride (PVC)
- Acrylonitrile Butadiene Styrene (ABS)
- Other Plastics
By Feedstock Source
- Post-Consumer Plastics
- Post-Industrial Plastics
By Recycling Process
- Sorting
- Washing and Cleaning
- Shredding and Grinding
- Extrusion and Pelletizing
- Other Processing Operations
By Recycled Product Form
- Recycled Plastic Flakes
- Recycled Plastic Pellets/Granules
- Regrind
- Compounded Recycled Resins
By Application
- Packaging
- Building and Construction
- Automotive and Transportation
- Electrical and Electronics
- Textiles and Fibers
- Consumer Goods and Household Products
- Agriculture
- Other Industrial Applications
By End-User Industry
- Packaging Manufacturers
- Automotive Manufacturers
- Construction Companies
- Electrical and Electronics Manufacturers
- Textile Producers
- Consumer Goods Manufacturers
- Other Industrial Users
By Recycling Technology
- Conventional Mechanical Recycling
- Advanced Sorting-Enabled Mechanical Recycling
- High-Purity and Food-Contact-Oriented Mechanical Recycling
By Region
- North America
- Europe
- Asia Pacific
- Latin America
- Middle East and Africa
For inquiries regarding discounts, bulk purchases, or customization requests, please contact us at sales@precedenceresearch.com
Frequently Asked Questions





Ask For Sample
No cookie-cutter, only authentic analysis – take the 1st step to become a Precedence Research client
 Get a Sample




 sales@precedenceresearch.com
 Schedule a Meeting